
Home Blog Page 7006

Outdoor Adventures and Flavors to Savor: Sierra Vista, Arizona

Javelina
Javelina

While much of the country is battling snowstorms, Sierra Vista, Arizona, is enjoying mild winter weather with picture-perfect, snow-topped peaks as a reminder that winter is in full swing. But with valley temperatures in the low 60s, tire chains and wooly under things are as mysterious as Chupacabra*.

While “going south” is usually associated with rising temperatures, Sierra Vista, at 4,633 feet, enjoys a comfortable climate all year long. In winter months, visitors can still explore without bundling up. Spring starts in late February with mercury rising to the low 70s. Blazing summer heat is unusual; June’s high 90s are broken with seasonal rainstorms.

The Huachucas (say “Waa-CHOO-kuhs” to sound like a local) are the southern most range of the Sky Islands, fast-rising peaks surrounded by radically different low lands, that create an ecosystem that is among the most diverse in the world, with narrow valleys, steep canyons, and soaring peaks that invite biodiversity seen nowhere else in the United States. In fact, the area attracts myriad avian life, more than any other place in the United States, giving Sierra Vista the nickname of “Hummingbird Capital of the United States. ”Here, you can find up to 15 species of hummingbirds—one found nowhere else north of Mexico—and more than 300 different bird species during the year.

Whether you road cycle or mountain bike, Sierra Vista is surrounded by miles of rolling, two-lane roads, bike lanes, and single-track mountain trails. The Huachucas reach a soaring 9,465 feet with some pretty steep trails for hearty hikers, although plenty of gentler trails still rate high with mountain bikers and hikers alike. One of the easiest routes (and perhaps most peaceful trail) is the path along the San Pedro River. This 54-mile trail is relatively flat (just 100 feet of elevation change) and offers multiple access points along the river.

ramsey canyon
Ramsey Canyon
brown canyon ranch
Brown Canyon Ranch
coronado vista
Coronado Vista

Sierra Vista is big enough for the best amenities, but small enough for a charming getaway. The city has earned a reputation for culinary diversity, thanks to the international restaurants tucked in plazas throughout the city. Offerings include flavors from around the world, attributed to nearby Fort Huachuca, whose soldiers returned from overseas with a hunger for world flavors. Drop into any of the eateries in jeans and hiking boots for a flavor-packed meal. Don’t let the unassuming (and sometimes kitschy) décor fool you into low expectations. The chefs won’t compromise when showcasing their homeland favorites. And luckily, reservations aren’t needed unless you have a big group.

Southeast Arizona grows about 80 percent of Arizona’s wine grapes at more than two dozen vineyards. Exploring nearby wine country and sampling the gold medal-winning wines produced there is a must. Along the way, the scenery will knock your socks off, especially if you are traveling at sunset: blasts of orange, pink, and purple light up the sky. Have your camera ready, the light changes quickly.

Find out more and start planning your getaway at SierraVistaAZ.com or download the interactive guide on your smart phone at your favorite app store. Just search“Sierra Vista Guide.”

*What is a Chupacabra you ask? An urban legend, a mythological question mark that roams the Southwest and Latin America attacking livestock under the cloak of darkness. Don’t worry, Chupacabraare as elusive as Big foot and you’re more likely to spot a coatimundi than this “goat sucker.

Read More
Administrator
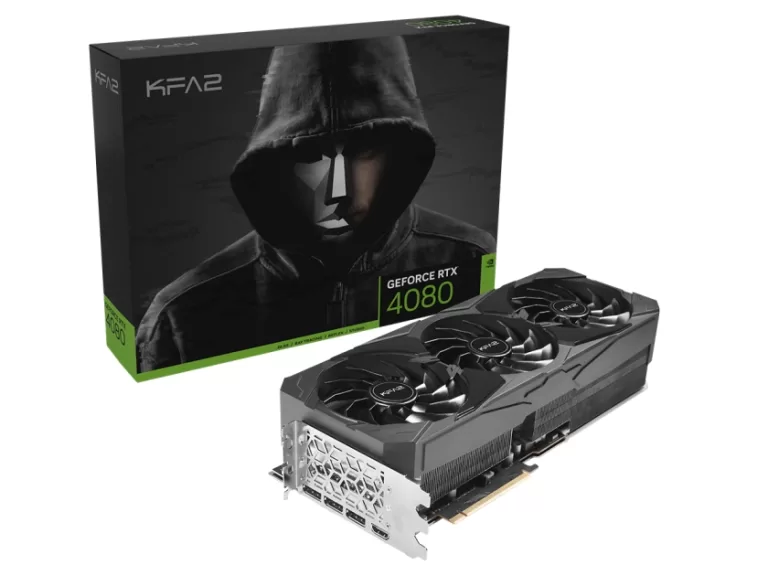
KFA2 GeForce RTX 4080 SG desktop GPU review: Great performance meets questionable pricing – NotebookCheck.net Reviews

FPS and RGB lighting galore! Alongside the GeForce RTX 4090, Nvidia has released the GeForce RTX 4080, a slightly less expensive model based on the company’s latest Ada Lovelace architecture. Nonetheless, manufacturers are asking more than €1,000 (US$1,070) for the second fastest graphics card from team green. We have now taken a closer look at an RTX 4080 model made by KFA2. In this review, you will find out where this card stands in terms of performance.

KFA2 GeForce RTX 4080 Serious Gaming
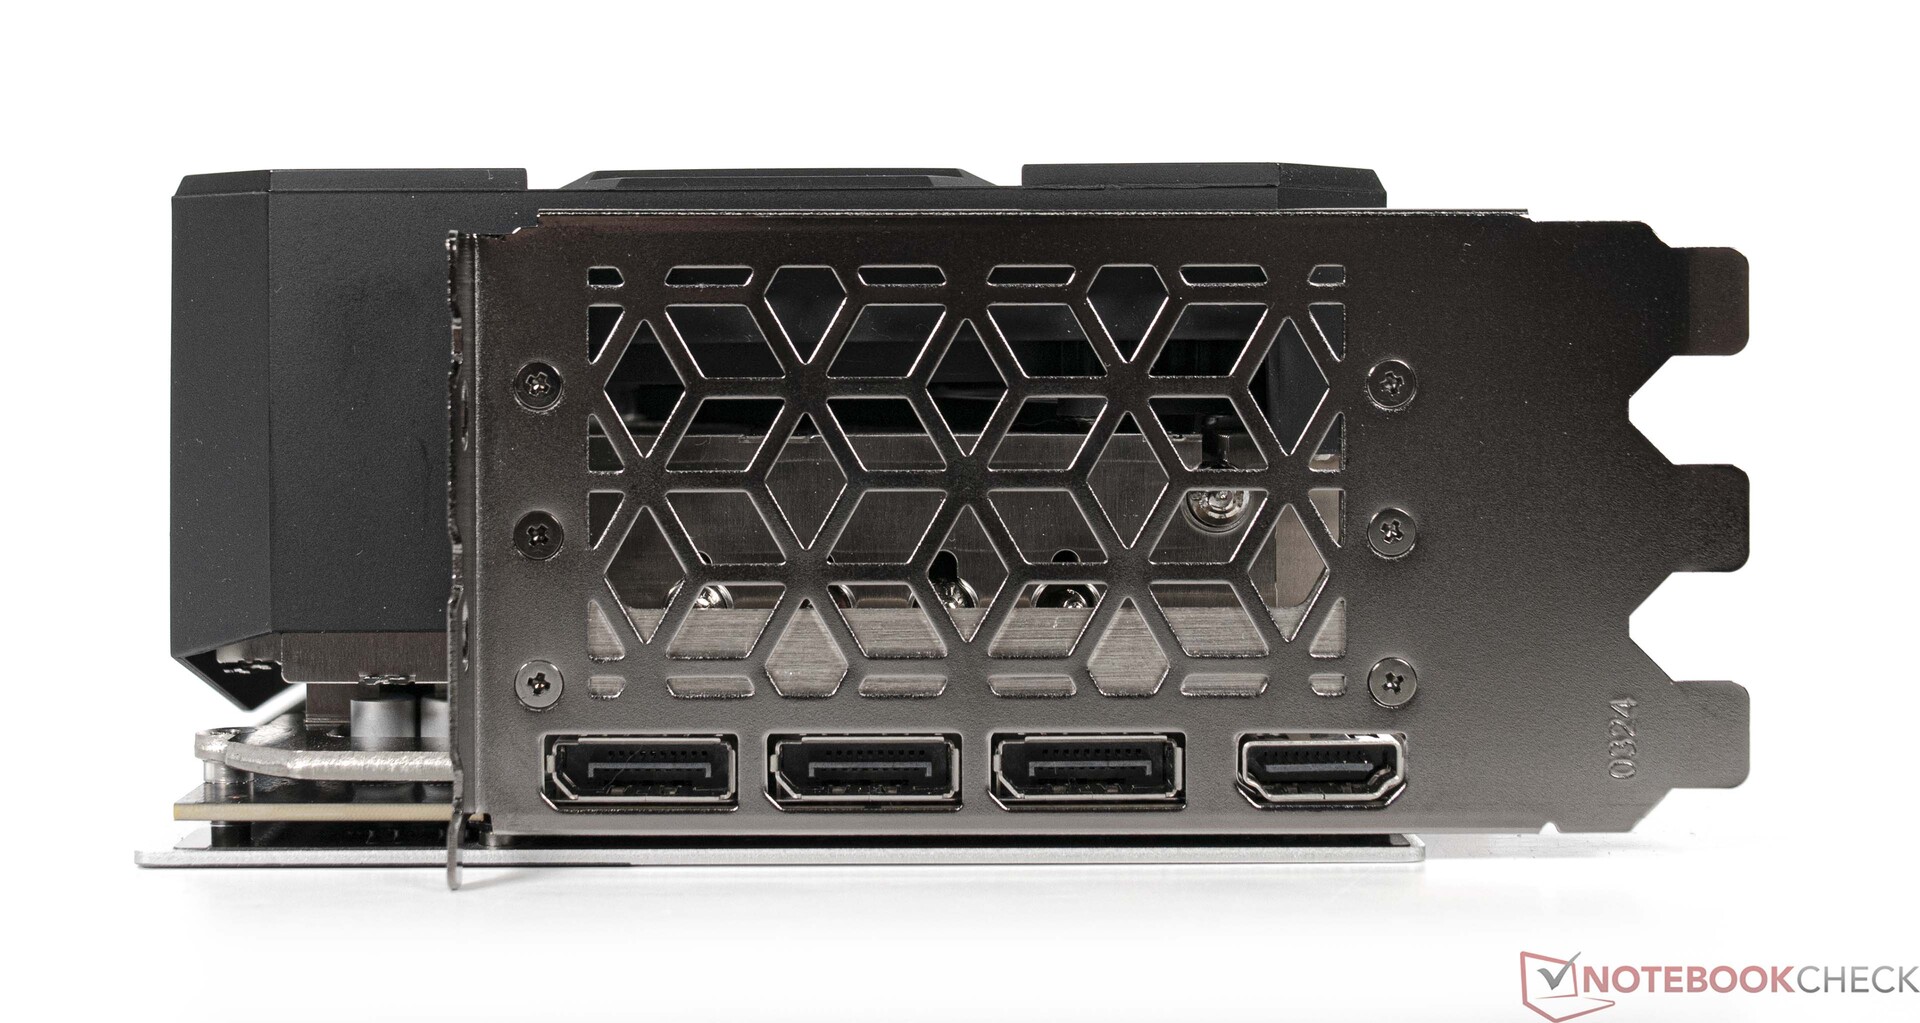
External connectors on the KFA2 GeForce RTX 4080 SG

After we recently reviewed the KFA2 GeForce RTX 4090 SG, it is now time for the smaller KFA2 GeForce RTX 4080 SG to showcase what it has got under the hood. Speaking of under the hood, unlike the Ampere lineup, the second fastest model of the current generation is based on a different graphics chip from the one on the top-end model. It uses the AD103 GPU, which is substantially smaller and thus cheaper to produce than the AD102. However, the lower production cost isn’t fully reflected in the current pricing. This is a widely discussed issue, and we too believe that prices must be reduced significantly so that the latest graphics cards don’t end up becoming shelf warmers. The RRP of the GeForce RTX 4080 has more than doubled compared with its predecessor (GeForce RTX 3080). We are going to leave our criticism of the pricing here for the time being. From this point on, we want to instead focus on the performance and features of the KFA2 GeForce RTX 4080 SG and discuss how well this model stacks up particularly against AMD’s RDNA3 GPUs.

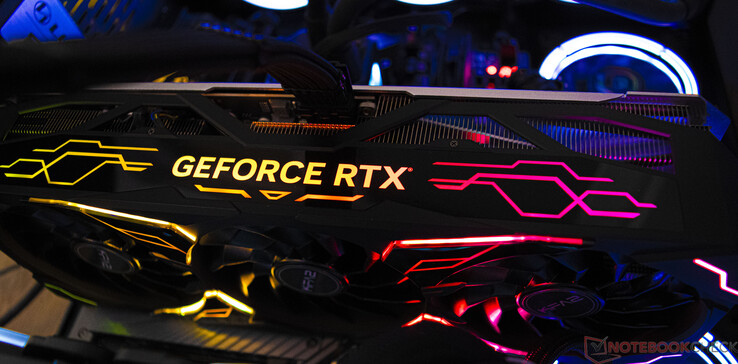
Although KFA2 is often one of the manufacturers with the lowest prices, the company considers itself a competitor of other manufacturers offering more expensive cards, such as Asus with its Strix series and MSI with its Suprim-X models. Unfortunately, we weren’t able to compare the different cards head-to-head because we have yet to get our hands on any Asus or MSI models. Nevertheless, we can say that the KFA2 GeForce RTX 4080 SG has the same level of workmanship as the KFA2 GeForce RTX 4090 SG. Despite having a much lower rated power usage than the top model, the KFA2 GeForce RTX 4080 SG is fitted with an enormous quad-slot cooler. There is also a ton of RGB lighting that draws attention to the card. As with all the current RTX 40 Series models, the RTX 4080 is powered via the new 12VHPWR connector. KFA2 hasn’t done anything differently here and has included an appropriate 3×6+2 pin PCIe to 12VHPWR adapter.

On the outside, the KFA2 GeForce RTX 4080 SG features 1x HDMI 2.1a port and 3x DisplayPort 1.4a.

SpecificationRTX 4090 (FE)RTX 4080KFA2 RTX 4080RTX 3090 TiRTX 3090 (FE)RTX 3080 Ti (FE)RTX 3080 (FE)Titan RTX
ChipAD102AD103AD103GA102GA102GA102GA102TU102
FinFET process4 nm4 nm4 nm8 nm8 nm8 nm8 nm12 nm
CUDA cores16.3849.7289.72810.75210.49610.2408.7044.608
Texture units512304304336328320272288
Tensor cores512 4. Gen.304 4. Gen.304 4. Gen.336 3. Gen.328 3. Gen.320 3. Gen.272 3. Gen.576 2. Gen.
RT cores12876768482806872
GPU base clock2,235 MHz2,205 MHz2,205 MHz1,560 MHz1,395 MHz1,365 MHz1,440 MHz1,350 MHz
GPU boost clock2,520 MHz2,505 MHz2,565 MHz1,860 MHz1,695 MHz1,665 MHz1,710 MHz1,770 MHz
Memory bus384 bit256 bit256 bit384 bit384 bit384 bit320 bit384 bit
Memory bandwidth1,008 GB/s716.8 GB/s716.8 GB/s1,008 GB/s936 GB/s912.4 GB/s760 GB/s672 GB/s
Video memory24 GB GDDR6X16 GB GDDR6X16 GB GDDR6X24 GB GDDR6X24 GB GDDR6X12 GB GDDR6X10 GB GDDR6X24 GB GDDR6
Power consumption450 W320 W320 W450 W350 W350 W320 W280 W

Our test system features a Gigabyte X670E Aorus Master motherboard paired with a high-performance AMD CPU (Ryzen 9 7950X), which is cooled by an Alphacool AIO solution (Alphacool Eisbaer Aurora 360 mm). The system has 32 GB of G.Skill memory running on an appropriate EXPO profile and is connected to a Gigabyte M32U monitor.

We used the following system for the benchmarks and tests in this review:

  • Lian-Li O11 Dynamic
  • AMD Ryzen 9 7950X
  • Gigabyte X670E Aorus Master, BIOS: F8a
  • Alphacool Eisbear 360 AIO
  • Corsair RM 1000x power supply
  • G.Skill Trident Z5 Neo DDR5-6000 2x 16 GB, EXPO (DDR5-6000 CL30-38-38-96)
  • Corsair MP600 2 TB
  • Crucial MX500 2 TB
  • Microsoft Windows 11 Professional 64-Bit (Version 22H2)

KFA2 has given the GeForce RTX 4080 SG slightly higher clock speeds than specified by Nvidia – the max boost clock has been increased by 60 MHz to be exact. But this is irrelevant in practice because we consistently managed to achieve higher speeds during our testing. On average, we saw GPU clock rates of roughly 2.8 GHz during gaming. The lightweight Xtreme Tuner tool allows users to control the fans and lighting on the graphics card. For our tests, however, we didn’t make any changes to the default settings. The 1-Click OC feature often found on KFA2 models is more just for show. In real-life applications, raising GPU speeds by just 15 MHz hardly makes any difference. We hope that this feature will bring significantly more to the table in future. Apart from the graphics card itself, in the box you’ll also find an optional fan designed to be mounted on the back of the card. Too bad the fan is incompatible with our motherboard, thus preventing us from using it in our review. The company has also included a GPU bracket (ARGB Dark Obelisk). This item is equipped with integrated RGB lighting and therefore goes well with the overall design of the KFA2 GeForce RTX 4080 SG.

In synthetic tests, the KFA2 GeForce RTX 4080 SG delivered exactly the same level of performance as the Founders Edition by Nvidia. The KFA2 card was able to outperformed an AMD Radeon RX 7900 XT by eleven per cent. AMD’s flagship GPU, the Radeon RX 7900 XTX, is within the same performance range and only negligibly faster than our review unit. After seeing a huge performance jump from the GeForce RTX 3090 to the RTX 4090, we observed a similar gain in performance when comparing the RTX 4080 with the RTX 3080 Ti. Overall, Nvidia’s Ada Lovelace architecture delivers a whopping 26 per cent more performance than Ampere.

In terms of compute performance, Nvidia clearly has the upper hand sometimes, whilst AMD is decidedly better in other instances. So those who are primarily looking for high compute performance should carefully consider what software programs they intend to use and which graphics card has an edge in those particular applications. As such, we can’t definitively recommend a particular product in this regard.

Like the KFA2 GeForce RTX 4090 SG, the KFA2 GeForce RTX 4080 SG offers immensely high gaming performance that only properly flexes its muscles at 2160p. Needless to say, the model can handle 1440p very comfortably, and the CPU is less of a limiting factor as with the faster RTX 4090. The AMD competitors don’t put up much of a fight against the KFA2 GeForce RTX 4080 SG, despite the fact that a few games run better on AMD graphics cards. On the other hand, there are also games that perform far better on Nvidia GPUs. Once ray tracing features are enabled, Nvidia cards pull even further ahead of the new RDNA3 graphics cards. Without DLSS, though, even the fastest Nvidia GPUs right now struggle with ray tracing at higher resolutions. As shown by Cyberpunk 2077, you’ll have to settle for 1080p when DLSS is disabled.

In any case, it should be noted that DLSS 3.0 is available exclusively on the new GeForce RTX 40 Series GPUs. AMD has a similar feature at the ready in the form of the open standard FSR, which can also be used with Nvidia GPUs. Ultimately, it is up to game developers to integrate these features into their games. You can click here to find a list of games that support DLSS 3.0 right now or are going to so in future.

GTA V – 3840×2160 High/On (Advanced Graphics Off) AA:FX AF:8x
Palit GeForce RTX 4090 GameRock OC


187.5 (2.97min, 200P1 – 593max) fps ∼100% +2%

GeForce RTX 4080 Founders Edition


186.1 (3.61min, 142.9P1 – 612max) fps ∼99% +1%

AMD Radeon RX 7900 XTX


184.8 (5.75min, 142.9P1 – 559max) fps ∼99% 0%

KFA2 GeForce RTX 4080 SG


183.9 (5.11min, 142.9P1 – 570max) fps ∼98%

ASUS TUF Gaming GeForce RTX 3080 Ti OC


182.6 (2.49min, 125P1 – 569max) fps ∼97% -1%

NVIDIA GeForce RTX 3090 Founders Edition


182.5 (2.85min, 142.9P1 – 284max) fps ∼97% -1%

MSI Radeon RX 6950 XT Gaming X Trio


175.5 (4.99min, 125P1 – 618max) fps ∼94% -5%

AMD Radeon RX 7900 XT


175.1 (5.09min, 125P1 – 687max) fps ∼93% -5%

Sapphire AMD Radeon RX 6950 XT Nitro+ Pure


173.1 (2.93min, 100P1 – 384max) fps ∼92% -6%

KFA2 GeForce RTX 3080 SG


169.6 (14.8min, 125P1 – 411max) fps ∼90% -8%

Nvidia Titan RTX


140.8 (6.17min, 100P1 – 320max) fps ∼75% -23%

The Witcher 3 – 3840×2160 High Graphics & Postprocessing (Nvidia HairWorks Off)
Palit GeForce RTX 4090 GameRock OC


284 (88.3min, 166.6P0.1, 240P1 – 831max) fps ∼100% +41%

GeForce RTX 4080 Founders Edition


204 (183min, 183.55P1 – 227max) fps ∼72% +1%

KFA2 GeForce RTX 4080 SG


202 (77.2min, 112.7P0.1, 171.7P1 – 783max) fps ∼71%

AMD Radeon RX 7900 XTX


163.8 (49.6min, 112P0.1, 134.1P1 – 463max) fps ∼58% -19%

AMD Radeon RX 7900 XT


158.5 (83.2min, 111.2P0.1, 122.8P1 – 408max) fps ∼56% -22%

NVIDIA GeForce RTX 3090 Founders Edition


155.5 (28min, 94.5P0.1, 133.8P1 – 704max) fps ∼55% -23%

ASUS TUF Gaming GeForce RTX 3080 Ti OC


154.9 (54.5min, 91.3P0.1, 134.4P1 – 636max) fps ∼55% -23%

MSI Radeon RX 6950 XT Gaming X Trio


148.3 (41.6min, 103P0.1, 117.2P1 – 530max) fps ∼52% -27%

Sapphire AMD Radeon RX 6950 XT Nitro+ Pure


139.7 (10.4min, 105.6P0.1, 118.6P1 – 388max) fps ∼49% -31%

KFA2 GeForce RTX 3080 SG


131.8 (48.2min, 72.3P0.1, 107.3P1 – 454max) fps ∼46% -35%

AMD Radeon RX 6900 XT


122 (105min, 105P1 – 134max) fps ∼43% -40%

Nvidia Titan RTX


107.1 (11min, 80.3P0.1, 94.1P1 – 583max) fps ∼38% -47%

Final Fantasy XV Benchmark – 3840×2160 High Quality
Palit GeForce RTX 4090 GameRock OC


161.1 fps ∼100% +38%

KFA2 GeForce RTX 4080 SG


116.9 fps ∼73%

GeForce RTX 4080 Founders Edition


115.4 fps ∼72% -1%

AMD Radeon RX 7900 XTX


101.6 fps ∼63% -13%

NVIDIA GeForce RTX 3090 Founders Edition


87.1 fps ∼54% -25%

ASUS TUF Gaming GeForce RTX 3080 Ti OC


86.4 fps ∼54% -26%

Sapphire AMD Radeon RX 6950 XT Nitro+ Pure


86 fps ∼53% -26%

MSI Radeon RX 6950 XT Gaming X Trio


85.6 fps ∼53% -27%

AMD Radeon RX 7900 XT


84.9 fps ∼53% -27%

KFA2 GeForce RTX 3080 SG


76.7 fps ∼48% -34%

Nvidia Titan RTX


65.2 fps ∼40% -44%

Strange Brigade – 3840×2160 ultra AA:ultra AF:16
Palit GeForce RTX 4090 GameRock OC


281 (31.7min, 239P1 – 482max) fps ∼100% +44%

KFA2 GeForce RTX 4080 SG


195.1 (12.1min, 170.6P1 – 503max) fps ∼69%

MSI Radeon RX 6950 XT Gaming X Trio


175 (140min, 143.3P1 – 264max) fps ∼62% -10%

AMD Radeon RX 7900 XT


172.6 (138.4min, 143.7P1 – 320max) fps ∼61% -12%

AMD Radeon RX 7900 XTX


172.6 (138.4min, 143.7P1 – 320max) fps ∼61% -12%

Sapphire AMD Radeon RX 6950 XT Nitro+ Pure


168.6 (37.6min, 139.6P1 – 268max) fps ∼60% -14%

NVIDIA GeForce RTX 3090 Founders Edition


163.2 (60.1min, 136.1P1 – 584max) fps ∼58% -16%

ASUS TUF Gaming GeForce RTX 3080 Ti OC


161.8 (38.7min, 135.9P1 – 423max) fps ∼58% -17%

KFA2 GeForce RTX 3080 SG


141.5 (44.1min, 113.4P1 – 188.6max) fps ∼50% -27%

Nvidia Titan RTX


115 (67.4min, 100P1 – 517max) fps ∼41% -41%

Far Cry 5 – 3840×2160 Ultra Preset AA:T
Palit GeForce RTX 4090 GameRock OC


175 (140min – 212max) fps ∼100% +26%

AMD Radeon RX 7900 XTX


155 (134min – 180max) fps ∼89% +12%

GeForce RTX 4080 Founders Edition


140 (126min – 159max) fps ∼80% +1%

KFA2 GeForce RTX 4080 SG


139 (125min – 163max) fps ∼79%

AMD Radeon RX 7900 XT


132 (116min – 162max) fps ∼75% -5%

MSI Radeon RX 6950 XT Gaming X Trio


126 (109min – 157max) fps ∼72% -9%

Sapphire AMD Radeon RX 6950 XT Nitro+ Pure


121 (106min – 147max) fps ∼69% -13%

ASUS TUF Gaming GeForce RTX 3080 Ti OC


109 (98min – 128max) fps ∼62% -22%

NVIDIA GeForce RTX 3090 Founders Edition


107 (96min – 128max) fps ∼61% -23%

KFA2 GeForce RTX 3080 SG


102 (93min – 121max) fps ∼58% -27%

Nvidia Titan RTX


82 (73min – 99max) fps ∼47% -41%

Far Cry New Dawn – 3840×2160 Ultra Preset
Palit GeForce RTX 4090 GameRock OC


145 (104min – 215max) fps ∼100% +12%

AMD Radeon RX 7900 XTX


138 (98min – 216max) fps ∼95% +6%

KFA2 GeForce RTX 4080 SG


130 (102min – 169max) fps ∼90%

AMD Radeon RX 7900 XT


129 (97min – 184max) fps ∼89% -1%

MSI Radeon RX 6950 XT Gaming X Trio


125 (96min – 174max) fps ∼86% -4%

Sapphire AMD Radeon RX 6950 XT Nitro+ Pure


111 (75min – 167max) fps ∼77% -15%

ASUS TUF Gaming GeForce RTX 3080 Ti OC


110 (85min – 131max) fps ∼76% -15%

NVIDIA GeForce RTX 3090 Founders Edition


108 (93min – 129max) fps ∼74% -17%

AMD Radeon RX 6900 XT


101 (79min – 135max) fps ∼70% -22%

KFA2 GeForce RTX 3080 SG


98 (79min – 122max) fps ∼68% -25%

Nvidia Titan RTX


83 (70min – 100max) fps ∼57% -36%

Far Cry 6 – 3840×2160 Ultra Graphics Quality + HD Textures AA:T
Palit GeForce RTX 4090 GameRock OC


136.9 (122min – 148max) fps ∼100% +28%

AMD Radeon RX 7900 XTX


124 (113min – 136max) fps ∼91% +16%

GeForce RTX 4080 Founders Edition


109 (97min – 117max) fps ∼80% +2%

KFA2 GeForce RTX 4080 SG


107 (98min – 116max) fps ∼78%

AMD Radeon RX 7900 XT


104.1 (95min – 114max) fps ∼76% -3%

MSI Radeon RX 6950 XT Gaming X Trio


94.7 (87min – 103max) fps ∼69% -11%

Sapphire AMD Radeon RX 6950 XT Nitro+ Pure


86.5 (78min – 100max) fps ∼63% -19%

ASUS TUF Gaming GeForce RTX 3080 Ti OC


86.2 (79min – 93max) fps ∼63% -19%

NVIDIA GeForce RTX 3090 Founders Edition


84.9 (78min – 92max) fps ∼62% -21%

Nvidia Titan RTX


63.6 (56min – 69max) fps ∼46% -41%

KFA2 GeForce RTX 3080 SG


57.2 (28min – 69max) fps ∼42% -47%

Metro Exodus – 3840×2160 Ultra Quality AF:16x
Palit GeForce RTX 4090 GameRock OC


139.7 (76.95min – 229.15max) fps ∼100% +34%

GeForce RTX 4080 Founders Edition


105.7 (67.17min – 159.57max) fps ∼76% +2%

KFA2 GeForce RTX 4080 SG


103.9 (62.73min – 167.39max) fps ∼74%

AMD Radeon RX 7900 XTX


103.5 (66.43min – 144.4max) fps ∼74% 0%

AMD Radeon RX 7900 XT


86.9 (56.86min – 117.84max) fps ∼62% -16%

MSI Radeon RX 6950 XT Gaming X Trio


79.3 (52.59min – 103.86max) fps ∼57% -24%

ASUS TUF Gaming GeForce RTX 3080 Ti OC


77.1 (48.66min – 128.68max) fps ∼55% -26%

NVIDIA GeForce RTX 3090 Founders Edition


75.9 (48.64min – 130.4max) fps ∼54% -27%

Sapphire AMD Radeon RX 6950 XT Nitro+ Pure


75 (50.07min – 98.87max) fps ∼54% -28%

AMD Radeon RX 6900 XT


66.7 (42.71min – 92.25max) fps ∼48% -36%

KFA2 GeForce RTX 3080 SG


65.2 (41.36min – 117.12max) fps ∼47% -37%

Nvidia Titan RTX


56.8 (35.78min – 93.88max) fps ∼41% -45%

F1 2020 – 3840×2160 Ultra High Preset AA:T AF:16x
Palit GeForce RTX 4090 GameRock OC


286 (245min – 335max) fps ∼100% +42%

KFA2 GeForce RTX 4080 SG


201 (172min – 235max) fps ∼70%

AMD Radeon RX 7900 XTX


199.6 (160min – 242max) fps ∼70% -1%

AMD Radeon RX 7900 XT


165.5 (136min – 199max) fps ∼58% -18%

MSI Radeon RX 6950 XT Gaming X Trio


158.1 (126min – 189max) fps ∼55% -21%

Sapphire AMD Radeon RX 6950 XT Nitro+ Pure


150.1 (119min – 178max) fps ∼52% -25%

ASUS TUF Gaming GeForce RTX 3080 Ti OC


145.9 (124min – 173max) fps ∼51% -27%

NVIDIA GeForce RTX 3090 Founders Edition


143.6 (121min – 170max) fps ∼50% -29%

AMD Radeon RX 6900 XT


137 (109min – 165max) fps ∼48% -32%

AMD Radeon RX 6900 XT


136 (110min – 161max) fps ∼48% -32%

KFA2 GeForce RTX 3080 SG


124.6 (107min – 145max) fps ∼44% -38%

Nvidia Titan RTX


103.4 (89min – 121max) fps ∼36% -49%

F1 2021 – 3840×2160 Ultra High Preset + Raytracing AA:T AF:16x
Palit GeForce RTX 4090 GameRock OC


199.1 (168min, 166P1 – 223max) fps ∼100% +38%

KFA2 GeForce RTX 4080 SG


144.3 (123min, 122P1 – 162max) fps ∼72%

GeForce RTX 4080 Founders Edition


143.5 (123min, 115P1 – 160max) fps ∼72% -1%

AMD Radeon RX 7900 XTX


133.6 (114min, 113P1 – 154max) fps ∼67% -7%

AMD Radeon RX 7900 XT


112.3 (95min, 95P1 – 129max) fps ∼56% -22%

ASUS TUF Gaming GeForce RTX 3080 Ti OC


105.6 (91min, 91P1 – 117max) fps ∼53% -27%

NVIDIA GeForce RTX 3090 Founders Edition


102.7 (90min, 89P1 – 116max) fps ∼52% -29%

MSI Radeon RX 6950 XT Gaming X Trio


102.1 (86min, 86P1 – 116max) fps ∼51% -29%

Sapphire AMD Radeon RX 6950 XT Nitro+ Pure


99.7 (85min, 85P1 – 113max) fps ∼50% -31%

KFA2 GeForce RTX 3080 SG


93.5 (82min, 82P1 – 105max) fps ∼47% -35%

Nvidia Titan RTX


73.2 (64min, 64P1 – 84max) fps ∼37% -49%

F1 22 – 3840×2160 Ultra High Preset AA:T AF:16x
Palit GeForce RTX 4090 GameRock OC


82.5 (72min, 71P1 – 96max) fps ∼100% +42%

GeForce RTX 4080 Founders Edition


58.9 (50min, 49P1 – 68max) fps ∼71% +2%

KFA2 GeForce RTX 4080 SG


57.9 (50min, 49P1 – 67max) fps ∼70%

AMD Radeon RX 7900 XTX


52.4 (37min, 38P1 – 64max) fps ∼64% -9%

AMD Radeon RX 7900 XT


44.9 (32min, 32P1 – 57max) fps ∼54% -22%

ASUS TUF Gaming GeForce RTX 3080 Ti OC


43.4 (36min, 36P1 – 51max) fps ∼53% -25%

NVIDIA GeForce RTX 3090 Founders Edition


42.6 (36min, 28P1 – 49max) fps ∼52% -26%

MSI Radeon RX 6950 XT Gaming X Trio


36.5 (27min, 27P1 – 47max) fps ∼44% -37%

Sapphire AMD Radeon RX 6950 XT Nitro+ Pure


35.8 (24min, 25P1 – 47max) fps ∼43% -38%

Nvidia Titan RTX


29.3 (25min, 24P1 – 34max) fps ∼36% -49%

Borderlands 3 – 3840×2160 Badass Overall Quality (DX11)
Palit GeForce RTX 4090 GameRock OC


135 fps ∼100% +42%

GeForce RTX 4080 Founders Edition


95.7 fps ∼71% +1%

KFA2 GeForce RTX 4080 SG


95.2 fps ∼71%

AMD Radeon RX 7900 XTX


88.4 fps ∼65% -7%

AMD Radeon RX 7900 XT


74.6 fps ∼55% -22%

ASUS TUF Gaming GeForce RTX 3080 Ti OC


73.8 fps ∼55% -22%

NVIDIA GeForce RTX 3090 Founders Edition


72.8 fps ∼54% -24%

MSI Radeon RX 6950 XT Gaming X Trio


70.9 fps ∼53% -26%

KFA2 GeForce RTX 3080 SG


59.9 fps ∼44% -37%

Sapphire AMD Radeon RX 6950 XT Nitro+ Pure


59.9 fps ∼44% -37%

AMD Radeon RX 6900 XT


59.8 fps ∼44% -37%

AMD Radeon RX 6900 XT


57.1 fps ∼42% -40%

Nvidia Titan RTX


49.7 fps ∼37% -48%

Cyberpunk 2077 1.5 – 3840×2160 Ultra Preset
Palit GeForce RTX 4090 GameRock OC


78 (48.3min – 106.8max) fps ∼100% +23%

AMD Radeon RX 7900 XTX


71.4 (59.4min – 93.7max) fps ∼92% +13%

GeForce RTX 4080 Founders Edition


63.5 (42.2min – 84.6max) fps ∼81% 0%

KFA2 GeForce RTX 4080 SG


63.4 (54min – 82.1max) fps ∼81%

AMD Radeon RX 7900 XT


60 (44.6min – 79.3max) fps ∼77% -5%

ASUS TUF Gaming GeForce RTX 3080 Ti OC


49.7 (41.5min – 63.7max) fps ∼64% -22%

MSI Radeon RX 6950 XT Gaming X Trio


48.5 (39.1min – 63.9max) fps ∼62% -24%

Sapphire AMD Radeon RX 6950 XT Nitro+ Pure


43.2 fps ∼55% -32%

Metro Exodus – 1920×1080 Ultra Quality DXR AF:16x
NVIDIA GeForce RTX 4090
AMD Ryzen 9 7950X, NVIDIA GeForce RTX 4090


157.3 (96.47min – 223.46max) fps ∼100% +6%

NVIDIA GeForce RTX 4080
AMD Ryzen 9 7950X, NVIDIA GeForce RTX 4080


148.6 (73.78min – 213.36max) fps ∼94%

AMD Radeon RX 7900 XTX
AMD Ryzen 9 7950X, AMD Radeon RX 7900 XTX


141.2 (89.03min – 194.63max) fps ∼90% -5%

NVIDIA GeForce RTX 4080
Intel Core i9-13900K, NVIDIA GeForce RTX 4080


137.2 (68.42min – 213.17max) fps ∼87% -8%

AMD Radeon RX 7900 XT
AMD Ryzen 9 7950X, AMD Radeon RX 7900 XT


124.3 (78.88min – 166max) fps ∼79% -16%

NVIDIA GeForce RTX 3080 Ti
AMD Ryzen 9 7950X, NVIDIA GeForce RTX 3080 Ti


121.2 (66.05min – 193.46max) fps ∼77% -18%

NVIDIA GeForce RTX 3090
AMD Ryzen 9 7950X, NVIDIA GeForce RTX 3090


115.4 (65.7min – 181.59max) fps ∼73% -22%

AMD Radeon RX 6950 XT
AMD Ryzen 9 7950X, AMD Radeon RX 6950 XT


110.2 (69.77min – 143.88max) fps ∼70% -26%

Far Cry 6 – 1920×1080 Ultra Graphics Quality + HD Textures + DXR AA:T
NVIDIA GeForce RTX 4080
Intel Core i9-13900K, NVIDIA GeForce RTX 4080


154 (125min – 209max) fps ∼100% +22%

AMD Radeon RX 7900 XTX
AMD Ryzen 9 7950X, AMD Radeon RX 7900 XTX


152.1 (75min – 229max) fps ∼99% +20%

AMD Radeon RX 7900 XT
AMD Ryzen 9 7950X, AMD Radeon RX 7900 XT


143.6 (46min – 227max) fps ∼93% +13%

NVIDIA GeForce RTX 4090
AMD Ryzen 9 7950X, NVIDIA GeForce RTX 4090


133.4 (108min – 196max) fps ∼87% +5%

AMD Radeon RX 6950 XT
AMD Ryzen 9 7950X, AMD Radeon RX 6950 XT


132.8 (51min – 198max) fps ∼86% +5%

NVIDIA GeForce RTX 3080 Ti
AMD Ryzen 9 7950X, NVIDIA GeForce RTX 3080 Ti


128.6 (109min – 170max) fps ∼84% +1%

NVIDIA GeForce RTX 4080
AMD Ryzen 9 7950X, NVIDIA GeForce RTX 4080


126.7 (103min – 189max) fps ∼82%

NVIDIA GeForce RTX 3090
AMD Ryzen 9 7950X, NVIDIA GeForce RTX 3090


123 (106min – 155max) fps ∼80% -3%

AMD Radeon RX 6800
AMD Ryzen 9 7950X, AMD Radeon RX 6800


112.6 (63min – 152max) fps ∼73% -11%

AMD Radeon RX 6950 XT
AMD Ryzen 9 5900X, AMD Radeon RX 6950 XT


101.6 (24min – 161max) fps ∼66% -20%

Cyberpunk 2077 1.5
3840×2160 Ray Tracing Ultra Preset (DLSS off)
NVIDIA GeForce RTX 4090
AMD Ryzen 9 7950X, NVIDIA GeForce RTX 4090 (1.6)


42.5 (31.9min – 56.3max) fps ∼100% +43%

NVIDIA GeForce RTX 4080
Intel Core i9-13900K, NVIDIA GeForce RTX 4080 (1.6)


30.7 (23.5min – 40.6max) fps ∼72% +3%

NVIDIA GeForce RTX 4080
AMD Ryzen 9 7950X, NVIDIA GeForce RTX 4080 (1.61)


29.8 (22.7min – 39.4max) fps ∼70%

NVIDIA GeForce RTX 3090
AMD Ryzen 9 7950X, NVIDIA GeForce RTX 3090 (1.6)


20.8 (14.2min – 28.9max) fps ∼49% -30%

AMD Radeon RX 7900 XTX
AMD Ryzen 9 7950X, AMD Radeon RX 7900 XTX (1.61)


20.7 (14.4min – 28.9max) fps ∼49% -31%

NVIDIA GeForce RTX 3080 Ti
AMD Ryzen 9 7950X, NVIDIA GeForce RTX 3080 Ti (1.61)


18.6 (9.13min – 27.1max) fps ∼44% -38%

AMD Radeon RX 7900 XT
AMD Ryzen 9 7950X, AMD Radeon RX 7900 XT (1.61)


17.6 (12min – 25max) fps ∼41% -41%

AMD Radeon RX 6950 XT
AMD Ryzen 9 7950X, AMD Radeon RX 6950 XT (1.61)


13.7 (9.28min – 20.6max) fps ∼32% -54%

AMD Radeon RX 6800
AMD Ryzen 9 7950X, AMD Radeon RX 6800 (1.61)


9.47 (6.59min – 14.7max) fps ∼22% -68%

1920×1080 Ray Tracing Ultra Preset (DLSS off)
NVIDIA GeForce RTX 4090
AMD Ryzen 9 7950X, NVIDIA GeForce RTX 4090 (1.6)


118.6 (69.3min – 161.9max) fps ∼100% +23%

NVIDIA GeForce RTX 4080
Intel Core i9-13900K, NVIDIA GeForce RTX 4080 (1.6)


100.1 (77.6min – 133.3max) fps ∼84% +4%

NVIDIA GeForce RTX 4080
AMD Ryzen 9 7950X, NVIDIA GeForce RTX 4080 (1.61)


96.1 (60.6min – 138.8max) fps ∼81%

NVIDIA GeForce RTX 3080 Ti
AMD Ryzen 9 7950X, NVIDIA GeForce RTX 3080 Ti (1.61)


69.1 (53.3min – 89.8max) fps ∼58% -28%

NVIDIA GeForce RTX 3090
AMD Ryzen 9 7950X, NVIDIA GeForce RTX 3090 (1.6)


65.7 (51min – 85.4max) fps ∼55% -32%

AMD Radeon RX 7900 XTX
AMD Ryzen 9 7950X, AMD Radeon RX 7900 XTX (1.61)


64.6 (49.1min – 85.9max) fps ∼54% -33%

AMD Radeon RX 7900 XT
AMD Ryzen 9 7950X, AMD Radeon RX 7900 XT (1.61)


57.1 (41.7min – 77.1max) fps ∼48% -41%

AMD Radeon RX 6950 XT
AMD Ryzen 9 7950X, AMD Radeon RX 6950 XT (1.61)


47.7 (32.5min – 66.9max) fps ∼40% -50%

AMD Radeon RX 6800
AMD Ryzen 9 7950X, AMD Radeon RX 6800 (1.61)


33.7 (23.1min – 47.4max) fps ∼28% -65%

Control – 1920×1080 High Quality Preset & High Ray Tracing Preset (DX12)
NVIDIA GeForce RTX 4090
AMD Ryzen 9 7950X, NVIDIA GeForce RTX 4090


189.9 (19.4min, 126.6P0.1, 139.6P1 – 292max) fps ∼100% +19%

NVIDIA GeForce RTX 4080
Intel Core i9-13900K, NVIDIA GeForce RTX 4080


162.8 (28.9min, 60.8P0.1, 129.4P1 – 273max) fps ∼86% +2%

NVIDIA GeForce RTX 4080
AMD Ryzen 9 7950X, NVIDIA GeForce RTX 4080


159.4 (18.2min, 92.7P0.1, 125.9P1 – 262max) fps ∼84%

AMD Radeon RX 7900 XTX
AMD Ryzen 9 7950X, AMD Radeon RX 7900 XTX


133.7 (23.2min, 92.6P0.1, 104.6P1 – 239max) fps ∼70% -16%

NVIDIA GeForce RTX 3080 Ti
AMD Ryzen 9 7950X, NVIDIA GeForce RTX 3080 Ti


120.6 (6.57min, 82.4P0.1, 100.1P1 – 224max) fps ∼64% -24%

AMD Radeon RX 7900 XT
AMD Ryzen 9 7950X, AMD Radeon RX 7900 XT


116.1 (8.47min, 62.1P0.1, 91.4P1 – 219max) fps ∼61% -27%

AMD Radeon RX 6950 XT
AMD Ryzen 9 7950X, AMD Radeon RX 6950 XT


102.9 (20.6min, 66.5P0.1, 80.5P1 – 242max) fps ∼54% -35%

AMD Radeon RX 6950 XT
AMD Ryzen 9 5900X, AMD Radeon RX 6950 XT


97.7 (7.66min, 62.8P0.1, 73.5P1 – 198.6max) fps ∼51% -39%

Ghostwire Tokyo – 1920×1080 Highest Settings + Maximum Ray Tracing
NVIDIA GeForce RTX 4090
AMD Ryzen 9 7950X, NVIDIA GeForce RTX 4090


183.2 (43min, 94.2P0.1, 137.8P1 – 221max) fps ∼100% +15%

NVIDIA GeForce RTX 4080
Intel Core i9-13900K, NVIDIA GeForce RTX 4080


166.2 (30.4min, 60P0.1, 115.2P1 – 248max) fps ∼91% +4%

NVIDIA GeForce RTX 4080
AMD Ryzen 9 7950X, NVIDIA GeForce RTX 4080


159.6 (39.5min, 86.7P0.1, 114.5P1 – 226max) fps ∼87%

AMD Radeon RX 7900 XTX
AMD Ryzen 9 7950X, AMD Radeon RX 7900 XTX


136.3 (39.1min, 76.4P0.1, 95.8P1 – 243max) fps ∼74% -15%

NVIDIA GeForce RTX 3080 Ti
AMD Ryzen 9 7950X, NVIDIA GeForce RTX 3080 Ti


119.9 (39.2min, 61.9P0.1, 80.9P1 – 230max) fps ∼65% -25%

AMD Radeon RX 7900 XT
AMD Ryzen 9 7950X, AMD Radeon RX 7900 XT


116.5 (30.3min, 71.6P0.1, 78.1P1 – 246max) fps ∼64% -27%

AMD Radeon RX 6950 XT
AMD Ryzen 9 7950X, AMD Radeon RX 6950 XT


99 (35.8min, 58.6P0.1, 66P1 – 237max) fps ∼54% -38%

The Callisto Protocol – 1920×1080 Ultra Preset (without FSR Upscaling) + Full Ray-Tracing
AMD Radeon RX 7900 XTX
AMD Ryzen 9 7950X, AMD Radeon RX 7900 XTX


98 fps ∼100% +13%

NVIDIA GeForce RTX 4090
AMD Ryzen 9 7950X, NVIDIA GeForce RTX 4090


92 fps ∼94% +6%

AMD Radeon RX 7900 XT
AMD Ryzen 9 7950X, AMD Radeon RX 7900 XT


89 fps ∼91% +2%

NVIDIA GeForce RTX 4080
AMD Ryzen 9 7950X, NVIDIA GeForce RTX 4080


87 fps ∼89%

AMD Radeon RX 6950 XT
AMD Ryzen 9 7950X, AMD Radeon RX 6950 XT


84 fps ∼86% -3%

NVIDIA GeForce RTX 3080 Ti
AMD Ryzen 9 7950X, NVIDIA GeForce RTX 3080 Ti


76 fps ∼78% -13%

AMD Radeon RX 6800
AMD Ryzen 9 7950X, AMD Radeon RX 6800


66 fps ∼67% -24%

Spider-Man Miles Morales – 1920×0180 Very High Preset + Ray-Tracing AA:T
NVIDIA GeForce RTX 4090
AMD Ryzen 9 7950X, NVIDIA GeForce RTX 4090


122.2 (60.2min, 67.7P0.1, 89P1 – 221max) fps ∼100% +7%

NVIDIA GeForce RTX 4080
AMD Ryzen 9 7950X, NVIDIA GeForce RTX 4080


114.7 (49.8min, 65.7P0.1, 93.2P1 – 157.5max) fps ∼94%

AMD Radeon RX 7900 XTX
AMD Ryzen 9 7950X, AMD Radeon RX 7900 XTX


98.6 (68.4min, 71.9P0.1, 82.3P1 – 147.1max) fps ∼81% -14%

NVIDIA GeForce RTX 3080 Ti
AMD Ryzen 9 7950X, NVIDIA GeForce RTX 3080 Ti


93.9 (66.7min, 73.8P0.1, 79.2P1 – 160.1max) fps ∼77% -18%

AMD Radeon RX 7900 XT
AMD Ryzen 9 7950X, AMD Radeon RX 7900 XT


88.5 (67.1min, 70.7P0.1, 74.7P1 – 196.4max) fps ∼72% -23%

AMD Radeon RX 6950 XT
AMD Ryzen 9 7950X, AMD Radeon RX 6950 XT


80.9 (60.3min, 63.4P0.1, 67.7P1 – 165.3max) fps ∼66% -29%

AMD Radeon RX 6800
AMD Ryzen 9 7950X, AMD Radeon RX 6800


65 (48.7min, 50.9P0.1, 52.4P1 – 129.3max) fps ∼53% -43%

lowmed.highultraQHD4K
GTA V (2015)188.1188187.7164.3159.2183.9
The Witcher 3 (2015)811719549268202
Dota 2 Reborn (2015)287.8256.8247.1228.6221.7
Final Fantasy XV Benchmark (2018)236235225195.7116.9
X-Plane 11.11 (2018)219193.6149.4124.9
Far Cry 5 (2018)239209203188185139
Strange Brigade (2018)681548531482390195.1
Shadow of the Tomb Raider (2018)334299304288241132.2
Far Cry New Dawn (2019)196173166150149130
Metro Exodus (2019)300256212177.7153.7103.9
Control (2019)24024023516282.4
Borderlands 3 (2019)239203189.9187.2163.295.2
F1 2020 (2020)552478463396332201
F1 2021 (2021)656606514256240144.3
Far Cry 6 (2021)205177.3161.6155150.6107
Forza Horizon 5 (2021)302242238177164124
God of War (2022)274271229164.9136.395.3
GRID Legends (2022)318287254237233163.3
Cyberpunk 2077 1.5 (2022)216213201190.1129.163.4
Ghostwire Tokyo (2022)294283252124.6
Tiny Tina’s Wonderlands (2022)385320269226165.889
F1 22 (2022)423411384172.8113.857.9
The Quarry (2022)37629124920714979.2
FIFA 23 (2022)278274274274272218
A Plague Tale Requiem (2022)174.1172.5153.912795.454.4
Uncharted Legacy of Thieves Collection (2022)145.5144.7142.1140.4125.677.7
Call of Duty Modern Warfare 2 2022 (2022)317286230219170112
Spider-Man Miles Morales (2022)198.6180.3178.2157.3202103.9
The Callisto Protocol (2022)23121317217113885
Need for Speed Unbound (2022)177.8171.4160.4140.3137.8104.5

The KFA2 GeForce RTX 4080 SG has a power draw rated at 320 watts – which is on the same level as a Founders Edition card from Nvidia. Even though its power usage has remained unchanged compared with a GeForce RTX 3080, the RTX 4080 outperformed its predecessor considerably in our tests. Power efficiency has been improved by an impressive margin with Ada Lovelace and the 4 nm node. The power target of the KFA2 GeForce RTX 4080 SG can be increased by up to 31 per cent, allowing the graphics card alone to consume as much as 420 watts of power. Using the 12VHPWR connector (included in the box as an adapter with 3×6+2 pin PCIe connectors), the GPU’s power draw is still within permissible limits. In order to avoid problems with power supply, we recommend using three separate cables to connect the card to the PSU.  

During the stress test, the KFA2 GeForce RTX 4080 SG reached 320 watts effortlessly, and we recorded GPU temperature of around 74°C (165°F). However, GPU hotspot temperature was as high as 93°C (199°F) under load. The VRAM remained astoundingly cool at 58°C (136°F). The KFA2 card relies on one massive heatsink with three 102 mm axial fans to dissipate heat. Optionally, another 102 mm fan can be installed on the back of the card. Unfortunately, we weren’t unable to test it out due to incompatibility with our motherboard. The fans generated a quiet whirring sound that could still be heard with the computer case closed (42 dB(A) of noise based on our measurement). When we increased the power limit, noise levels from the GPU rose to 43 dB(A). During gaming (The Witcher 3, 1080p, Ultra preset), our setup produced a pleasant 36 dB(A) of noise. We also didn’t notice any annoying coil whine. 

In terms of power consumption, the KFA2 GeForce RTX 4080 SG leaves a good impression and is neck and neck with the AMD Radeon RX 7900 XT – a card that delivers significantly less performance. The KFA GeForce RTX 3080 SG, which we previously reviewed, required more power under load. Compared with the KFA2 GeForce RTX 4090 SG, the smaller Ada Lovelace graphics card uses 30 per cent less power under load. Nonetheless, it bears mentioning that the RTX 4090 is rated at 450 watts and offers substantially higher performance. 

The manufacturer recommends using a 750-watt PSU. This recommendation is based on a system with an AMD Ryzen 9 5900X. But if your system has a Ryzen 9 7000 Series processor or an Intel Raptor Lake processor, you should take into consideration the higher power usage of these CPUs under load. Therefore, we recommend pairing the graphics card with an 850-watt PSU.

Noise Level

Idle

30.9 / 30.9 / 30.9 dB(A)

Load 31 / 42.1 dB(A)
  red to green bar
 

30 dB
silent

40 dB(A)
audible

50 dB(A)
loud


min: dark, med: mid, max: light   Earthworks M23R, Arta (15 cm distance)   environment noise: 30.4 dB(A)

dB(A) 0102030405060708090Deep BassMiddle BassHigh BassLower RangeMidsHigher MidsLower HighsMid HighsUpper HighsSuper Highs2033.331.232.53233.931.533.32532.433.631.130.729.631.732.4313131.731.329.63030.6314029.329.429.328.530.730.329.35028.934.234.233.533.432.928.96328.327.727.827.927.927.728.38028.326.126.428.829.126.928.310027.72625.625.324.526.827.712525.425.224.924.523.724.425.416025.125.123.823.323.62425.120025.724.222.822.822.522.425.725025.524.521.422.821.121.225.531524.822.620.221.320.821.324.840024.721.519.82020.520.124.750023.620.619.219.719.21923.663023.820.318.618.919.118.923.880025.52118.418.31818.225.5100026.422.117.917.317.817.226.4125028.920.817.416.917.216.928.91600312116.816.817.316.931200032.623.816.616.517.316.532.6250031.520.516.816.616.916.331.5315030.221.116.316.51816.130.240002919.716.416.417.416.629500028.517.316.716.717.116.528.563002417.116.716.81716.624800019.917.116.916.917.116.819.91000018.217.417.217.217.117.118.21250017.817.717.517.617.417.417.81600018.118.3181817.917.918.1SPL40.832.729.629.629.929.540.8N3.31.81.31.31.31.33.3median 25.5median 21median 17.9median 17.6median 17.9median 17.4median 25.5Delta2.42.72.22.31.82.22.4hearing rangehide median Fan Noise
Power Consumption / The Witcher 3 ultra (external Monitor)
MSI Radeon RX 6950 XT Gaming X Trio
MSI Radeon RX 6950 XT Gaming X Trio, AMD Ryzen 9 7950X (Idle: 79.6 W)


610 (607min, 608P1 – 618max) Watt * ∼100% -32%

Sapphire AMD Radeon RX 6950 XT Nitro+ Pure
Sapphire AMD Radeon RX 6950 XT Nitro+ Pure, AMD Ryzen 9 5900X


589 (583min, 584P1 – 598max) Watt * ∼97% -28%

AMD Ryzen 7 5800X3D
AMD Ryzen 7 5800X3D, AMD Ryzen 7 5800X3D (Idle: 102 W)


561 (533min, 542P1 – 582max) Watt * ∼92% -22%

KFA2 GeForce RTX 4090 SG
KFA2 GeForce RTX 4090 SG, AMD Ryzen 9 7950X


546 (526min, 532P1 – 564max) Watt * ∼90% -18%

AMD Radeon RX 7900 XTX
AMD Radeon RX 7900 XTX, AMD Ryzen 9 7950X (Idle: 86.5 W)


540 (527min, 530P1 – 564max) Watt * ∼89% -17%

NVIDIA GeForce RTX 3090 Founders Edition
NVIDIA GeForce RTX 3090 Founders Edition, AMD Ryzen 9 7950X


538 (532min, 532P1 – 570max) Watt * ∼88% -17%

ASUS TUF Gaming GeForce RTX 3080 Ti OC
ASUS TUF Gaming GeForce RTX 3080 Ti OC, AMD Ryzen 9 7950X (Idle: 78.2 W)


528 (511min, 523P1 – 549max) Watt * ∼87% -15%

KFA2 GeForce RTX 3080 SG
KFA2 GeForce RTX 3080 SG, AMD Ryzen 9 5900X


518 (509min, 510P1 – 539max) Watt * ∼85% -12%

AMD Radeon RX 6900 XT
AMD Radeon RX 6900 XT, AMD Ryzen 9 5950X (Idle: 99.15 W)


488.3 (459.99min – 512.79max) Watt * ∼80% -6%

KFA2 GeForce RTX 4080 SG
KFA2 GeForce RTX 4080 SG, AMD Ryzen 9 7950X (Idle: 86.4 W)


461 (450min, 453P1 – 476max) Watt * ∼76%

AMD Radeon RX 7900 XT
AMD Radeon RX 7900 XT, AMD Ryzen 9 7950X (Idle: 84.6 W)


459 (451min, 453P1 – 488max) Watt * ∼75% -0%

Power Consumption / FurMark 1.19 GPU Stress Test (external Monitor)
KFA2 GeForce RTX 4090 SG
KFA2 GeForce RTX 4090 SG, AMD Ryzen 9 7950X


618 (593min, 605P1 – 652max) Watt * ∼100% -32%

MSI Radeon RX 6950 XT Gaming X Trio
MSI Radeon RX 6950 XT Gaming X Trio, AMD Ryzen 9 7950X (Idle: 79.6 W)


604 (579min, 587P1 – 627max) Watt * ∼98% -29%

Sapphire AMD Radeon RX 6950 XT Nitro+ Pure
Sapphire AMD Radeon RX 6950 XT Nitro+ Pure, AMD Ryzen 9 5900X


564 (525min, 551P1 – 601max) Watt * ∼91% -21%

AMD Radeon RX 7900 XTX
AMD Radeon RX 7900 XTX, AMD Ryzen 9 7950X (Idle: 86.5 W)


518 (501min, 502P1 – 525max) Watt * ∼84% -11%

NVIDIA GeForce RTX 3090 Founders Edition
NVIDIA GeForce RTX 3090 Founders Edition, AMD Ryzen 9 7950X


516 (512min, 514P1 – 541max) Watt * ∼83% -10%

ASUS TUF Gaming GeForce RTX 3080 Ti OC
ASUS TUF Gaming GeForce RTX 3080 Ti OC, AMD Ryzen 9 7950X (Idle: 78.2 W)


513 (500min, 506P1 – 527max) Watt * ∼83% -10%

AMD Radeon RX 7900 XT
AMD Radeon RX 7900 XT, AMD Ryzen 9 7950X (Idle: 84.6 W)


513 (500min, 506P1 – 527max) Watt * ∼83% -10%

KFA2 GeForce RTX 3080 SG
KFA2 GeForce RTX 3080 SG, AMD Ryzen 9 5900X


487 (475min, 477P1 – 501max) Watt * ∼79% -4%

KFA2 GeForce RTX 4080 SG
KFA2 GeForce RTX 4080 SG, AMD Ryzen 9 7950X (Idle: 86.4 W)


468 (453min, 459P1 – 480max) Watt * ∼76%

AMD Radeon RX 6900 XT
AMD Radeon RX 6900 XT, AMD Ryzen 9 5950X (Idle: 99.15 W)


456.8 (378.13min – 484.67max) Watt * ∼74% +2%

* … smaller is better

0255075100125150175200225250275300325350375400425450475Tooltip

Pros

+ high 3D performance

+ major jump in performance over the previous generation at the same TDP

+ modern 4 nm architecture

+ 16 GB of VRAM DLSS 3.0 with Frame Generation

+ fan stop mode

+ great design

+ attractive looking

+ optional fourth fan

+ sturdy GPU bracket with RGB lighting

Cons

awkwardly positioned power connector

very large (check for case compatibility)

no DisplayPort 2.1

too expensive

The KFA2 GeForce RTX 4080 SG is in every way an extremely fast graphics card and is suitable for running demanding games without compromise. Compared with the GeForce RTX 3080, the card is able to deliver substantially more performance at the same power consumption. The advantages of the new GPU generation is particularly apparent when ray tracing is enabled. Together with DLSS 3.0 (including Frame Generation), even new games can run smoothly at 2160p with ray tracing effects turned on. Unfortunately, though, you’ll need either a GeForce RTX 4080 or RTX 4090 to reach this level of performance. Users of older Nvidia GPUs are left out of the action.

The KFA2 model in this review features a specially developed design and a massive cooler that performed stupendously well during our review. It is even able too cool the card silently in 2D applications thanks to its fan stop mode. The GPU requires a lot of power and is rated at 320 watts, but this power usage still falls within a reasonable range. In our opinion, constantly increasing power consumption is not the right way forward.

The KFA2 GeForce RTX 4080 SG is a great graphics card and utterly impressed us with its high gaming performance. The wide array of RGB lighting draws attention to the massive cooler.

The graphics card is powered via a 12VHPWR connector. Opinions may be divided about this connector, but we still haven’t encountered any problems with it yet. The only issue is that we think the 12VHPWR connector is placed in a less-than-optimal spot. Due to how much the graphics card sticks out above the PCIe slot, enough space must be allocated to the large adapter cable so it doesn’t get kinked right beside the GPU. This could cause space issues in many computer cases.

The KFA2 GeForce RTX 4080 SG is competing with AMD’s latest Radeon RX 7900 graphics cards when we are talking about pure gaming performance without ray tracing. Our review unit often falls exactly between the performance of a Radeon RX 7900 XTX and Radeon RX 7900 XT. But as always, it depends on whether a specific game performs better on AMD or Nvidia cards. When ray tracing features are turned on, the KFA2 GeForce RTX 4080 SG clearly outperforms the Radeon RX 7900 XTX. This means you’ll have to settle for an Nvidia card if you don’t want to forego these features.

The KFA2 GeForce RTX 4080 SG is currently going for €1,379 (US$1,473), making the model actually much less expensive than a GeForce RTX 3090 Ti (approx. €1,600, or US$1,068), which offers worse performance. AMD’s Radeon RX 7900 XTX costs around €1,350 (US$1,442), but the slightly slower model (Radeon RX 7900 XT) will set you back €1,020 (US$1,090). With some luck, you might be able to grab the top-end model on AMD Shop for €1,120 (US$1,196). Right now, we are very critical of these prices because many users are unwilling to cough up such amounts of money for a graphics card.

Sebastian Bade, 2023-01- 3 (Update: 2023-01- 4)

Read More
Sebastian Bade

Gigabyte Aorus 17X and Aorus 15X presented with high-end Intel Alder Lake-HX processors and GeForce RTX 4000 graphics cards – NotebookCheck.net News

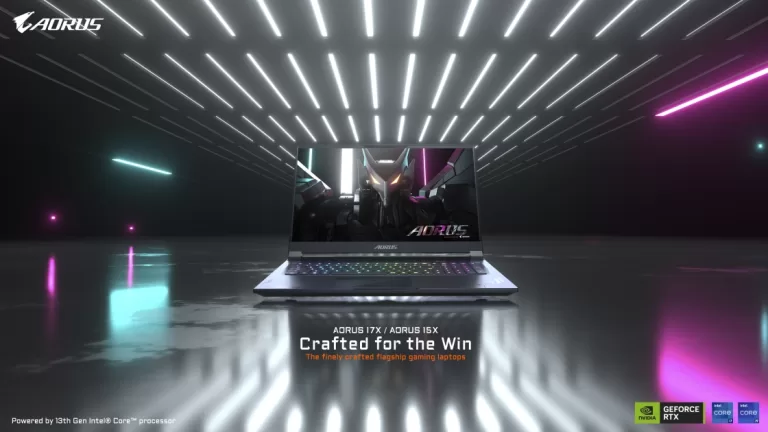
Gigabyte's new Aorus 17X and Aorus 15X gaming laptops are now official (image via Gigabyte)
Gigabyte’s new Aorus 17X and Aorus 15X gaming laptops are now official (image via Gigabyte)

Gigabyte has announced two new high-end gaming laptops, the Aorus 17X and Aorus 15X. Both feature 240 Hz QHD screens, a 13th-generation Intel Alder Lake processor, up to an Nvidia GeForce RTX 4090 and a 99 Wh battery.

Gigabyte has refreshed the Gigabyte Aorus 17X gaming laptop with current-generation hardware from Intel and Nvidia weeks after it got the Alder Lake-HX treatment. Its smaller sibling, the Aorus 15X also gets the same treatment, but with a different, slightly lower-speed SKU. The price and availability of both laptops will be announced later.

Starting with the Gigabyte Aorus 17X, one can configure it with Intel’s shiny new Core i9-13950HX processor. The 55 Watt Raptor Lake behemoth has eight Raptor Cove and sixteen Gracemont cores. It can boost up to 5.5 GHz on one core, but that may come at a tremendous power cost (157 Watts). For the graphics card, one gets an Nvidia GeForce RTX 4090. Unfortunately, Gigabyte has neglected to mention the Aorus 17X’s memory and storage options, only saying that it supports DDR5-5600 RAM. Lastly, the gaming laptop features a 17.3-inch QHD panel clocked at 240 Hz.

The smaller Gigabyte Aorus 15X packs the same 240 Hz QHD display but in a 15.6-inch form factor. As mentioned earlier, it uses an Intel core i9-13900HX Raptor Lake processor, which is identical to the Core i9-13950HX specs-wise, except for its boost clocks. Thankfully, the graphics card option remains unchanged with the GeForce RTX 4090, although its max TDP could be adjusted a bit to keep thermals in check. Once again, information about its memory and storage remains unknown but hopefully should emerge soon.

Gigabyte has used a CNC aluminium alloy chassis for the Aorus 17X and Aorus 15X. Thermals are kept in check by the company’s in-house Windforce cooling technology. An RGB strip is included at the back to complete the gamer aesthetic, along with the Gigabyte logo. Both SKUs have a 99 Wh battery and can output video to up to three devices.

Related Articles

Anil Ganti, 2023-01- 3 (Update: 2023-01- 3)

Read More
Anil Ganti

People Are Ready To Accept Changes To Save The Planet, Says Veolia CEO

Veolia CEO Estelle Brachlianoff arrives at a state dinner upon the visit of United Arab Emirates … [+] President at the Grand Trianon estate near the Palace of Versailles, south west of Paris, on July 18, 2022. – French President welcomes the United Arab Emirates President on July 18, 2022, whose state visit “will confirm the strong ties” between France and the rich Gulf oil country, the Elysee Palace announced on July 14, 2022. (Photo by Ludovic MARIN / various sources / AFP) / The erroneous mention[s] appearing in the metadata of this photo by Ludovic MARIN has been modified in AFP systems in the following manner: [Veolia CEO Estelle Brachlianoff] instead of [Veolia deputy General Director Estelle Brachalinoff]. Please immediately remove the erroneous mention[s] from all your online services and delete it (them) from your servers. If you have been authorized by AFP to distribute it (them) to third parties, please ensure that the same actions are carried out by them. Failure to promptly comply with these instructions will entail liability on your part for any continued or post notification usage. Therefore we thank you very much for all your attention and prompt action. We are sorry for the inconvenience this notification may cause and remain at your disposal for any further information you may require. (Photo by LUDOVIC MARIN/AFP via Getty Images)

AFP via Getty Images

The general public are far more aware of the consequences of climate change and ready to adapt than many politicians think, according to the CEO of the environmental services provider Veolia.

Speaking to Forbes, Estelle Brachlianoff said people are “far more ready” than some leaders think they are and understand “we have to act now” or face the more expensive consequences later on.

She said recent developments like the energy crisis, summer heatwaves and the war in Ukraine have made people more aware of issues like sustainability, food security and the need to develop locally sourced, renewable energy.

Veolia has just published the details of a worldwide survey by the French research and consulting firm, Elabe, which Brachlianoff said will be “shocking reading” for some politicians.

The survey shows that more than two thirds (67%) of the world’s inhabitants are certain that the costs of the consequences of climate change will be greater than any investments needed to tackle the issue.

A similar figure (60%) said they are ready to accept the economic, cultural and social changes necessary, provided there are no health risks and the solutions are proven to be useful.

The survey also found the majority (56%) of people around the world believe the solutions to mitigate pollution and climate change are not being sufficiently talked about.

Brachlianoff said the survey shows people around the world understand that the “cost of inaction will actually be higher than the cost of action” and they want to find out more about possible solutions, provided they are fair and effective.

“They’ve understood that the stakes will be far higher later on, and if we don’t act now, there is going to be a more expensive tomorrow,” she told Forbes.

But she added that public opinion is “not going to be fooled by a cherry on the cake” and people want “useful solutions that are scalable”.

She said trying to derive biogas energy out of waste and wastewater could be “one part of the jigsaw” and will mean energy supplies will not “depend on a guy turning on and off a gas pipe far away from here”.

And developing facilities to recycle wastewater would also help tackle issues like water scarcity, which has been a big issue in France over the last 12 months.

Brachlianoff said one of the issues holding back the deployment of the large-scale deployment of such solutions is red tape.

Companies like Veolia need a single point of entry to get the authorization they need, instead of “knocking on 20 doors” she added.

She said Veolia is also looking at solutions designed at tackling soil and air pollution.

Last year, Veolia announced a joint initiative with Jean-Michel Genestier, mayor of Le Raincy in Paris to make it the first town in France to guarantee 100% good air in its local school.

Veolia will continuously assess the quality of the air in the classrooms in real time and then deploy solutions to renew and treat the air inside the school building.

“We may not have all the solutions to fix everything, but let’s act on those we already have at our disposal,” added Brachlianoff.

Elabe’s president of research, Bernard Sananès added the new survey shows public opinion is convinced that “we are currently experiencing the end of a world, but not the end of the world”.

“While solutions to reduce our ecological impact are still little debated, this study helps us understand the conditions of their acceptability in order to accelerate the ecological transformation,” he added.

Follow me on Twitter or LinkedInCheck out some of my other work here

Read More
Jamie Hailstone

Local Entrepreneurial Couples Open Ninth Marco’s Pizza in Georgia with a New Location in Rockmart

Local Entrepreneurial Couples Open Ninth Marco's Pizza in Georgia with a New Location in Rockmart

Locally-Owned Eatery to Satisfy the Community’s Lunch and Dinner Cravings with its Delicious Pizza, Subs, Chicken Wings, and More

Local Entrepreneurial Couples Open Ninth Marco's Pizza in Georgia with a New Location in RockmartRockmart, GA  (RestaurantNews.comMarco’s Pizza has opened its newest location in Rockmart, GA on Dec. 19. Located at 102 Sycamore Grove Court, local residents can expect a variety of lunch, dinner, and catering options with fresh, high-quality ingredients from Marco’s Pizza.

Bringing Marco’s pizza-making prowess to Rockmart are two local married couples, Keene and Cynthia Murphy and Jeff and Sandy Hall. The Murphys and the Halls have teamed up in a variety of Georgia-based businesses including construction, real estate, childcare, and now they’re bringing their 9th Marco’s location in the state to Rockmart.

“Marco’s Pizza hopes to be a valuable addition to the Rockmart community because it will add a new lunch, dinner, catering and delivery option for the area,” said Keene Murphy. “Rockmart is an up-and-coming market and we’re excited for Marco’s Pizza to be a part of the growth and provide residents with the fresh, high-quality ingredients that Marco’s is known for.”

The Marco’s mouth-watering menu features a mix of classic and original specialty pizzas loaded with fresh toppings, including the White Cheezy, Deluxe, All Meat or Build-Your-Own Pizza and Pizza Bowls. Marco’s also meets consumers’ ever-changing dietary preferences by offering Cauliflower Crust pizza and Marco’s was the first national pizza delivery brand to offer Pizza Bowls – a crustless pizza baked in a bowl.  

Customers can also choose convenient lunch options such as oven-baked subs, along with creations like the CheezyBread, Chicken Dippers and Wings, salads and desserts. With carryout, delivery, app and online ordering options, Marco’s offers the ease of picking up a quick meal or having it delivered to your door.

Marco’s Pizza has carved out a niche in the industry for its high-quality pizza, known for its dough made from scratch for a craveable golden crust, freshly mixed herbs and spices for a sauce worth savoring and three fresh signature cheeses for a perfect, melty bite. Now, Rockmart pizza lovers can experience the delicious goodness they’ve been craving.  

For more information about the Marco’s Pizza location opening in Rockmart, please visit www.marcos.com, download the mobile app or call 678-685-8200. If you would like to join the Marco’s team as a delivery driver or pizza maker, please visit www.marcospizzajobs.com or apply in-person at the store.

About Marco’s Pizza

Headquartered in Toledo, Ohio, Marco’s Pizza is the fastest-growing pizza brand* in the United States. Marco’s was founded in 1978 by Italian-born Pasquale (“Pat”) Giammarco and thrives to deliver a high-quality pizza experience. Marco’s Pizza can be ordered for delivery or carryout by downloading the mobile app, going online to www.marcos.com or by calling each store directly.

* Marco’s Pizza is the fastest-growing pizza brand based on year-over-year unit growth, according to 2021 NRN Top 500 U.S. Restaurant Ranking LSR Pizza Segment.

Media Contact:
Marcus Durbin
Fishman PR
847-945-1300
md*****@*******pr.com


Read More
RestaurantNews.com

Robin Roberts Announces 2023 Wedding Plans With Partner Amber Laign

Good Morning America anchor Robin Roberts revealed she and longtime partner Amber Laign plan to get married this year. See her adorable wedding announcement.

Robin Roberts Talks Coming Out on “Ellen”

Wedding bells are in Robin Roberts‘ future.

The Good Morning America anchor revealed on Jan. 2 that she and longtime partner Amber Laign plan to get married in 2023.

“I’m hesitating because I haven’t said it out loud yet—I’m saying yes to marriage,” Roberts told motivational speaker Gabby Bernstein in a video that she posted on her Instagram. “We’re getting married this year.”

“It was something we had talked about but we had put it off, she became ill,” Roberts continued, referencing Laign’s battle with breast cancer. “It is saying yes to that, and that next chapter.”

In addition to the interview clip, Roberts, 62, shared on IG, “Saying YES to marriage in 2023. Always a joy to chat with @gabbybernstein…she joined us LIVE with a manifestation challenge to realize your dreams in the new year. #marriage #manifestation #loveislove.”

Roberts, who has been with Laign since 2005, first announced her partner’s health struggles in early 2022.

“At the end of last year, Amber was diagnosed with breast cancer,” Roberts revealed last February. “She had surgery last month and this morning will begin chemotherapy.”

“She and I have been together almost 17 years and have helped each other through our challenges, like my journey with cancer,” she continued. “It’s my turn now to be there for her like she was for me.”

In July, Roberts shared that Laign had completed radiation therapy. “We both thank you for all your well wishes and prayers,” she said on social media over the summer. “Proud of her and all fellow Thrivers for your grit and grace during a challenging time. This is indeed my #mondaymotivation.”

Roberts beat breast cancer herself in 2007 after undergoing surgery.

For the latest breaking news updates, click here to download the E! News App

Read More
msn.com

JINYA Ramen Bar Brings More Elevated Japanese Cuisine in Utah

JINYA Ramen Bar Brings More Elevated Japanese Cuisine in Utah

Acclaimed Japanese ramen restaurant to serve 100 free ramen bowls in celebration of Lehi grand opening

JINYA Ramen Bar Brings More Elevated Japanese Cuisine in UtahLehi, UT  (RestaurantNews.comJINYA Ramen Bar is introducing real ramen culture to more of the Salt Lake City community starting Monday, Jan. 9, with its newest location in Lehi!

Located at 3725 N. Thanksgiving Way next to Silicon Slopes’ headquarters and near Thanksgiving Point, the new JINYA restaurant is ready to grow with its neighbors and become the go-to spot for locals and visitors in the Salt Lake City area. The location is a genuine hot spot, as Thanksgiving Point is a draw for locals and tourists.

“We’re excited to be in such a lively part of the city with our newest location so close to all of the economic development in the area,” said JINYA Founder and CEO Tomo Takahashi. “We look forward to serving our savory ramen bowls to local Lehi residents and all the visitors that flock to Salt Lake City.”

Guests will want to get there early for the grand opening on Jan. 9 because the first 50 guests in line at lunch and dinner will receive a FREE ramen bowl. Guests can choose from more than a dozen acclaimed ramen dishes featuring a perfect balance of bold noodles with thick, rich broth, slowly simmered for 20 hours to ensure a deep flavor.

Lehi’s JINYA Ramen Bar will be open Monday through Saturday from 11 a.m. to 10 p.m. and Sunday from 11:30 a.m. to 10 p.m. This debut will mark the first JINYA Ramen Bar location in Lehi, the third in Utah – all in the Salt Lake City area – and 49th systemwide.

At JINYA, experience ramen like it’s meant to be – with thick, rich broth in perfect balance with flavorful noodles. Discover a wide array of authentic toppings, from tender pork chashu to a perfectly cooked and seasoned poached egg to shrimp wanton. Then, elevate the experience further by pairing it with tapas or a craft beer. JINYA is ramen culture, where the relationship between broth and noodles is serious but delicious business.

To learn more about JINYA’s full menu, visit jinyaramenbar.com.

JINYA Ramen Bar: A Bowl Above All Others

About JINYA Ramen Bar  

Founded in 2010 by Tomo Takahashi – who was named among the most influential restaurant CEOs in the country in 2022 by Nation’s Restaurant News – JINYA Ramen Bar has nearly 50 restaurants with multiple new locations in the pipeline. JINYA’s focus on kaizen – the Japanese practice of continuous improvement – means its guests will always experience the best ramen out there. From the water used to prepare its broth to the special aging process that its noodles undergo, JINYA pays meticulous attention to everything that goes into its guests’ bowls. JINYA also operates bushi by JINYA, Robata JINYA, LBD Japanese Bar and Lounge, and JINYA Ramen Express. For more information, visit jinyaramenbar.com and follow JINYA on Facebook, Instagram and TikTok. To learn more about JINYA’s franchising opportunities, visit jinyaramenbar.com/franchise.

Contact:
Kat McManigle
Champion
972-930-9933
km********@*********gt.com


Read More
RestaurantNews.com

‎Ministry of Housing signs MoU with Chinese firms on SAR 10.5 bln investments

Logo of the Ministry of Municipal, Rural Affairs and Housing

The Ministry of Municipal, Rural Affairs and Housing signed a memorandum of understanding (MoU) with the Metallurgical Corporation of China (MCC), Sinohydro-Sagarmatha Power Company (P) Ltd., China State Construction Engineering Corporation (CSCEC) and Overseas Development Co Ltd…
Camellia Kucera Read More

Bitcoin.gov.au: is Australia’s financial system headed for an official digital currency?

The RBA has some interesting things to say about the possibility of how digital currency could work as an official, central bank-issued part of Australia’s financial system.
The post Bitcoin.gov.au: is Australia’s financial system headed for an official digital currency? appeared first on Crikey…
Jason Murphy Read More

First Mover Asia: Tokocrypto Token Holders Benefit From Reports of Binance Acquiring the Indonesian Exchange

0

A Tokocrypto spokesperson would not confirm the deal, which has been widely reported by regional media. Binance is a Tokocrypto investor; bitcoin jumps back above $17K…
James Rubin, Glenn Ardi Read More