Asus Zenbook S 13 OLED 2023 review – The slimmest OLED ultrabook worldwide struggles with annoying fans – NotebookCheck.net Reviews

Slimmer isn’t always better. Asus has completely reworked last year’s Zenbook S13 OLED, and the new 2023 model has now become lighter and also slimmer. In addition, Asus has replaced the AMD chip with an Intel Raptor Lake processor, but that isn’t really an advantage. In everyday operation, the two fans are also a problem.

Asus has completely reworked its compact 13-inch ZenBook S 13 ultrabook, mainly concentrating on bringing an even lighter and slimmer device to the market. According to the marketing material, this is even the slimmest 13.3-inch OLED ultrabook in the world. In this redesign, the manufacturer also decided to replace the very good AMD processor of last year’s model with a current Raptor Lake chip from Intel. Of course, we will evaluate whether this was the right decision.

Our test unit of the Zenbook S 13 OLED is again equipped with a 13.3-inch OLED panel in the 16:10 format. In addition, there is an Intel Core i7-1355U, 16 GB of RAM, and a large 1 TB PCIe 4.0 SSD at an MSRP of 1,499 Euros (~$1,657). But we also have good news for fans of last year’s Zenbook S 13, since there will also be a refresh with AMD’s Zen4 CPUs.

Processor

Intel Core i7-1355U 10 x 1.2 – 5 GHz, 44 W PL2 / Short Burst, 17 W PL1 / Sustained, Raptor Lake-U

Memory

16 GB 

, LPDDR5, dual-channel, onboard

Display

13.30 inch 16:10, 2880 x 1800 pixel 255 PPI, capacitive, SDC417B, OLED, glossy: yes, HDR, 60 Hz

Mainboard

Intel Alder Lake-P PCH

Soundcard

Intel Raptor Lake-P/U/H PCH – cAVS

Connections

1 USB 3.0 / 3.1 Gen1, 2 USB 4.0 40 Gbps, 2 Thunderbolt, USB-C Power Delivery (PD), 1 HDMI, 2 DisplayPort, Audio Connections: 3.5 mm audio port, Brightness Sensor

Networking

Intel Wi-Fi 6E AX211 (a/b/g/h/n = Wi-Fi 4/ac = Wi-Fi 5/ax = Wi-Fi 6/ Wi-Fi 6E 6 GHz), Bluetooth 5.2

Size

height x width x depth (in mm): 11.8 x 296.2 x 216.3 ( = 0.46 x 11.66 x 8.52 in)

Battery

63 Wh, 8140 mAh Lithium-Polymer

Operating System

Microsoft Windows 11 Home

Camera

Webcam: 1080p
Primary Camera: 2 MPix

Additional features

Speakers: stereo, Keyboard: chiclet, 1.1 mm, Keyboard Light: yes, 65W PSU, sleeve, 24 Months Warranty

Weight

1.048 kg ( = 36.97 oz / 2.31 pounds), Power Supply: 228 g ( = 8.04 oz / 0.5 pounds)

Note: The manufacturer may use components from different suppliers including display panels, drives or memory sticks with similar specifications.

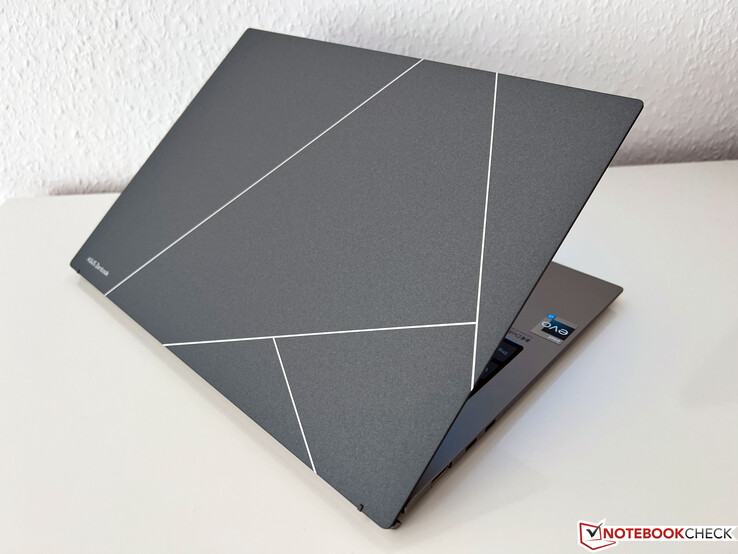
The case of the 2023 Zenbook S 13 follows a new design, including a new display hinge. This is an ErgoLift mechanism where the base unit is angled when raising the lid. This has both advantages and disadvantages, and while the angled base unit makes typing more comfortable, there is now a hard edge when placing the device on your thighs. The new Zenbook is available in either Ponder Blue or Basalt Grey color, and our gray test unit looks very good and elegant with the various shades of gray. In addition, we really like the large ProArt logo on top of the display cover.

Top of the display lid covered with a plasma ceramic coating

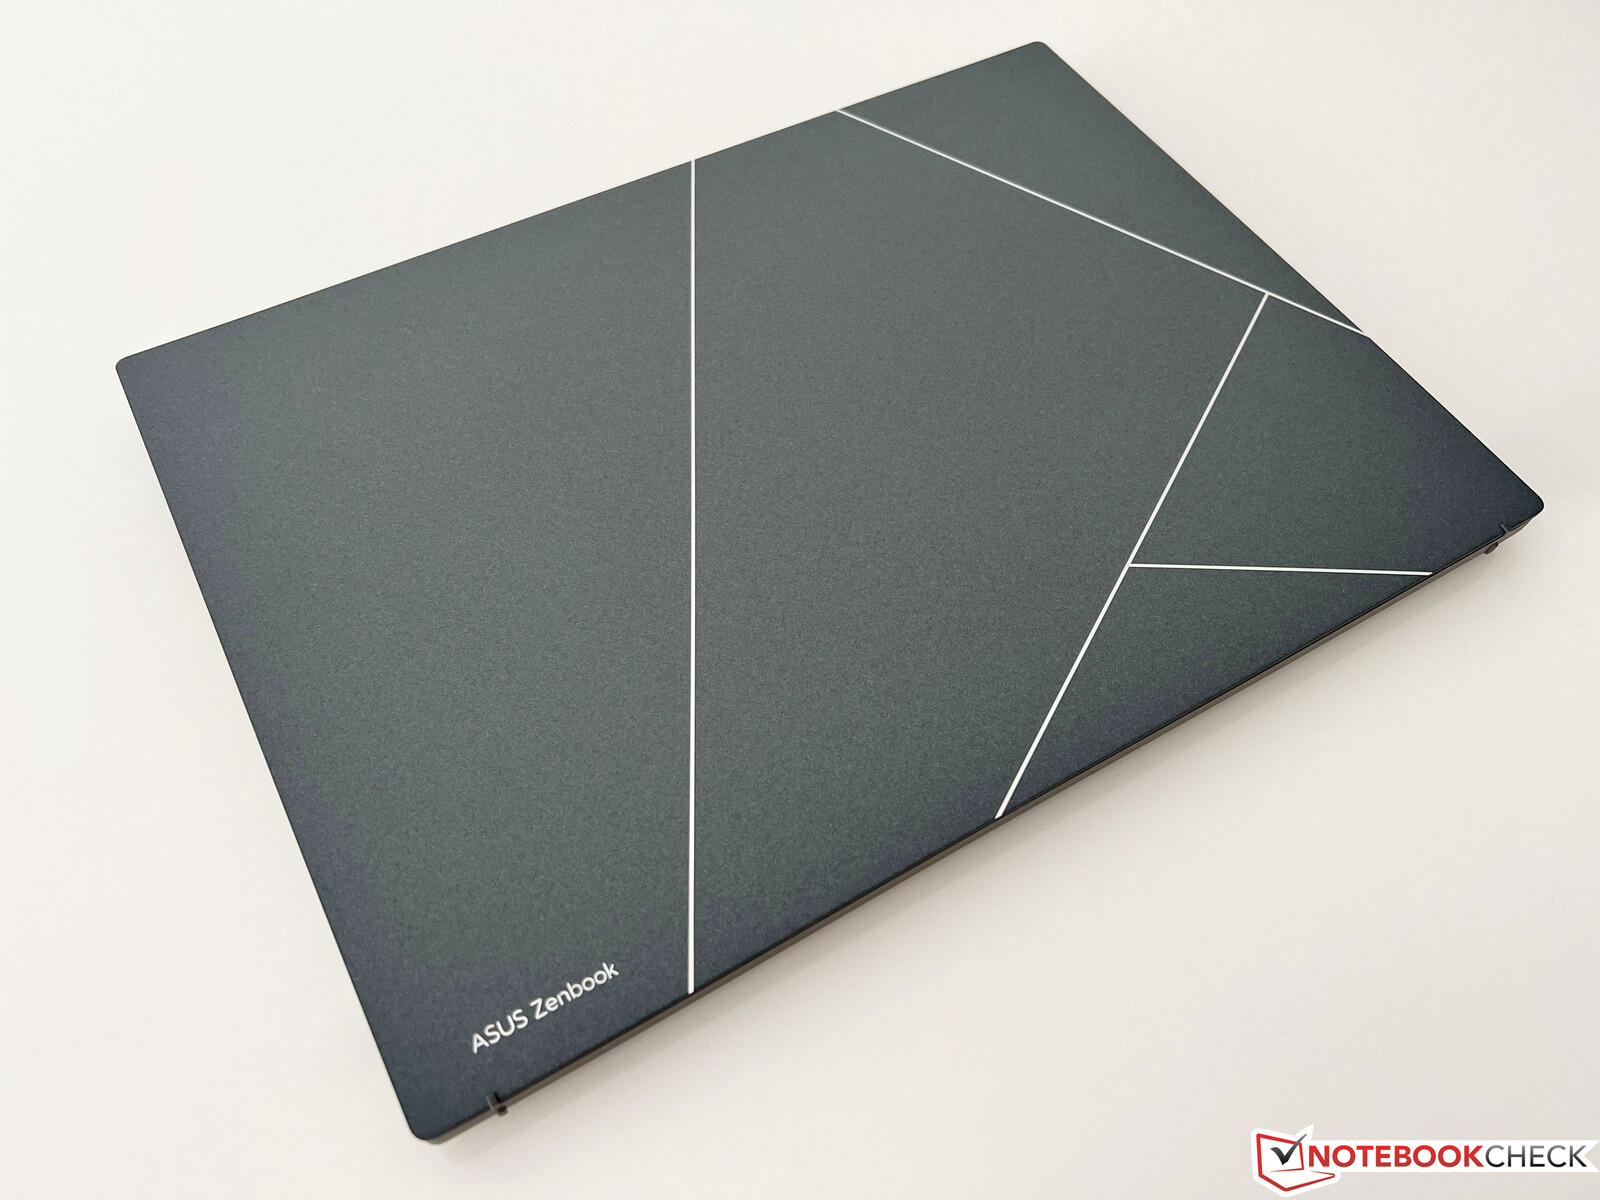
In addition to the new design, a new material is also used for the lid. Basically, the case is made from aluminum, which was then covered by a layer of plasma ceramic coating. This new surface technology offers various advantages such as improved resistance to wear and corrosion. In everyday operation, the slightly rough surface also has the advantage that you cannot see any fingerprints at all. After more than a week, we didn’t even need a cleaning cloth. According to the manufacturer, the production process is also more environmentally friendly.

The surface of the base unit is also slightly roughened, and fingerprints are also no problem there. The stability of the whole laptop leaves an excellent impression with us, and despite the slim build, neither the base unit nor the lid can be warped or bent excessively. The hinge is also adjusted well, even though this cannot prevent some slight wobbling after changing the opening angle. The maximum opening angle is 180 degrees.

The size comparison shows that the new Zenbook S 13 has particularly become slimmer. While it is also less thick than the Windows competitors, the current MacBook Air M2 from Apple is even minimally slimmer. On the other hand, the spec sheet is a little optimistic as far as the weight is concerned, since our test unit brings 1,048 grams (~3.263 lb) to the scale, placing only in the middle of the field with this. Compared to the predecessor, this is only a weight savings of 47 grams (~1.7 oz). In the thickness, the savings are at least 3 mm (~0.12 in), which is definitely noticeable. According to Asus, it is the lightest 13.3-inch OLED laptop, but some of the competitors with IPS panels are even lighter. But overall, the mobility of the Zenbook S 13 is of course excellent. The compact charger adds another 228 grams (~8 oz) to the weight.

After the Zenbook S 13 from last year used three USB-C ports exclusively, Asus now offers 2x USB-C, adding also a USB-A port (despite the slim case) an also a full-size HDMI port. This is simply much more practical in everyday operation, and since it is an Intel laptop, the two USB-C ports of course also support Thunderbolt 4.

Asus uses the modern AZ211 WLAN module from Intel, which already supports the most current Wi-Fi 6E WLAN standard as well as Bluetooth 5.2. However, in our test we were unable to connect to the corresponding 6-GHz network of our Asus reference router and therefore used the 5-GHz network instead. The transfer rates are very high overall and also stabile to a large extent. We also did not see any connection problems in practice.

Networking
Asus ZenBook S13 OLED UX5304
Intel Wi-Fi 6E AX211
iperf3 transmit AXE11000


1555 (min: 1319) MBit/s ∼100%

iperf3 receive AXE11000


1439 (min: 1353) MBit/s ∼93%

Asus Zenbook S 13 OLED
MediaTek Wi-Fi 6E MT7922 160MHz Wireless LAN Card
iperf3 transmit AXE11000


1492 (min: 1365) MBit/s ∼96%

iperf3 receive AXE11000


1553 (min: 1443) MBit/s ∼100%

Apple MacBook Air M2 Entry
802.11 a/b/g/n/ac/ax
iperf3 transmit AXE11000


865 (min: 856) MBit/s ∼56%

iperf3 receive AXE11000


945 (min: 924) MBit/s ∼61%

Lenovo Yoga Slim 7 Carbon 13IAP7-82U9005FGE
Intel Wi-Fi 6E AX211
iperf3 transmit AXE11000 6GHz


1635 (min: 1576) MBit/s ∼100%

iperf3 receive AXE11000 6GHz


1619 (min: 1580) MBit/s ∼98%

Samsung Galaxy Book2 Pro 13 NP930XED-KA1DE
Intel Wi-Fi 6E AX211
iperf3 transmit AXE11000 6GHz


1567 (min: 979) MBit/s ∼96%

iperf3 receive AXE11000 6GHz


1652 (min: 1633) MBit/s ∼100%

0501001502002503003504004505005506006507007508008509009501000105011001150120012501300135014001450150015501600Tooltip

Asus has updated the webcam and is now using a Full-HD webcam together with an IR sensor for face recognition in combination with Windows Hello. The quality is slightly better than last year’s and decent in good light conditions.

ColorChecker

6.5 ∆E

6.3 ∆E

8.8 ∆E

10.2 ∆E

11.4 ∆E

7.6 ∆E

6.1 ∆E

5.7 ∆E

11.6 ∆E

8.4 ∆E

6.5 ∆E

5.9 ∆E

2.1 ∆E

5.1 ∆E

13.3 ∆E

4.7 ∆E

10.5 ∆E

9.3 ∆E

8 ∆E

4.9 ∆E

5 ∆E

4.6 ∆E

1.3 ∆E

2.3 ∆E

ColorChecker Asus ZenBook S13 OLED UX5304: 6.92 ∆E min: 1.29 – max: 13.34 ∆E

The bottom cover is secured with Torx screws (T5) and can be removed easily. The inner construction is dominated by the large battery, and you can also see the two fans that can be cleaned. While the M.2 2280 SSD can be replaced, all the other components are soldered in.

For a slimmer case, the keystroke usually has to be reduced, and exactly that is also the case in the Zenbook S 13. While it was still 1.4 mm (~0.055 in) in the predecessor, it is now only 1.1 mm (~0.043), which is also noticeable. The feedback continues to be very crisp and it is by no means a bad keyboard, but the typing experience was simply a bit more comfortable with the predecessor. The fingerprint sensor in the power button was just removed without any replacement. The white, three-step keyboard illumination cannot be activated automatically via the brightness sensor.

The large ClickPad (13 x 8.1 cm, ~5.1 x 3.2 in) offers sufficient space for cursor movements and gestures of up to four fingers. The sliding characteristics are very good, and the regular cursor control works without a hitch. The bottom area of the ClickPad can be pressed down, which is accompanied by some loud clicking noises. In the previous model, the touchpad could also be used as a number block, but this feature was removed from the current version.

Subpixel grid
Subpixel grid

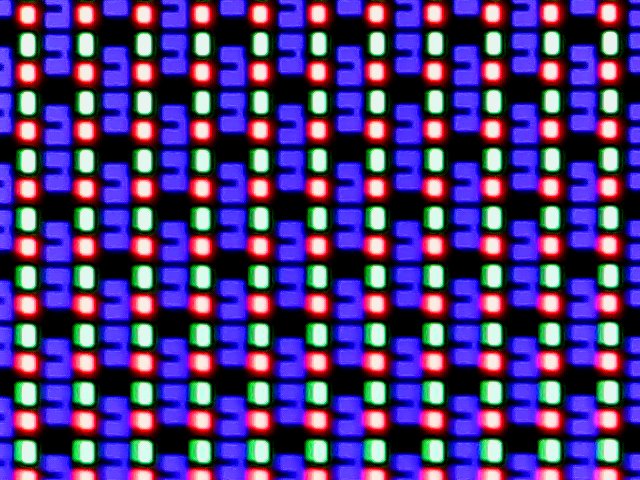
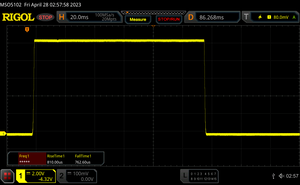
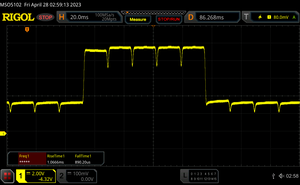
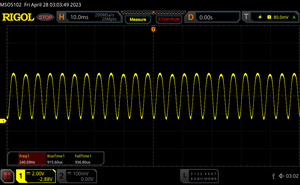
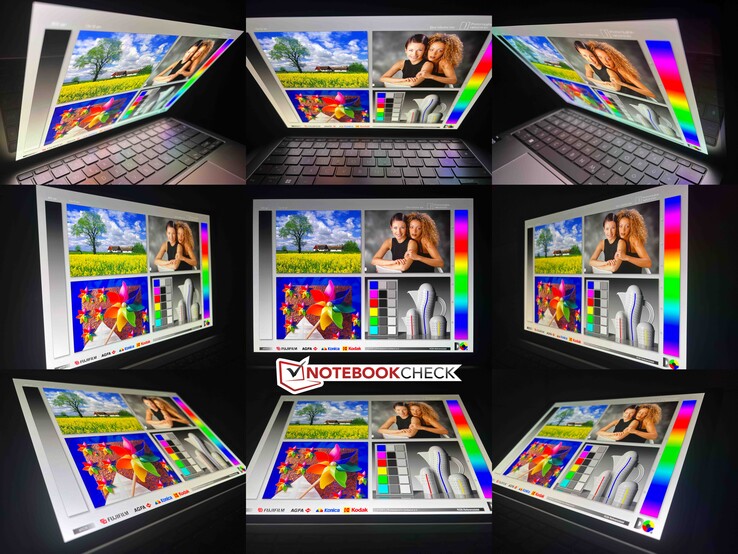
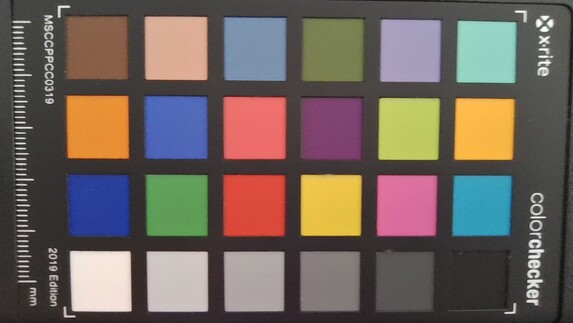
Asus keeps the display specifications of the Zenbook S 13 without any changes, since it continues to use a 13.3-inch OLED touchscreen with a refresh rate of 60 Hz. The resolution is 2,880 x 1,800 pixels, and the subjective image quality continues to be excellent. In addition, there is no glitter effect (Moiré effect) like in the 2.8K OLED panels of some Lenovo models. The panel ID is new, and according to Asus, this is a slightly thinner panel.

As far as brightness is concerned, we continue to have to distinguish between regular SDR and HDR contents. In SDR operation, the maximum brightness is ~360 cd/m² with the excellent OLED typical brightness distribution. At the same time, the black value is 0, causing an extremely high contrast ratio. In HDR operation, we measure a maximum of 589 cd/m², which is slightly higher than the specification of 550 cd/m². Since last year, nothing has changed in the bad HDR implementation of Windows. HDR has to be activated manually, and no color profiles will then be available anymore. There is no screen bleeding in OLED displays, and a black image is simply completely black.

368
cd/m²
365
cd/m²
365
cd/m²
367
cd/m²
361
cd/m²
365
cd/m²
367
cd/m²
363
cd/m²
366
cd/m²

Distribution of brightness

SDC417B

X-Rite i1Pro 2

Maximum: 368 cd/m² (Nits) Average: 365.2 cd/m² Minimum: 2 cd/m²
Brightness Distribution: 98 %
Center on Battery: 361 cd/m²
Contrast: ∞:1 (Black: 0 cd/m²)
ΔE Color 1.2 | 0.55-29.43 Ø5.2
ΔE Greyscale 1.2 | 0.57-98 Ø5.4
96.9% AdobeRGB 1998 (Argyll 2.2.0 3D)
100% sRGB (Argyll 2.2.0 3D)
99.7% Display P3 (Argyll 2.2.0 3D)
Gamma: 2.27

Asus ZenBook S13 OLED UX5304
SDC417B, OLED, 2880×1800, 13.30
Asus Zenbook S 13 OLED
SDC4172, OLED, 2880×1800, 13.30
Apple MacBook Air M2 Entry
IPS, 2560×1664, 13.60
Lenovo Yoga Slim 7 Carbon 13IAP7-82U9005FGE
MND307DA1-9, IPS, 2560×1600, 13.30
Dell XPS 13 Plus 9320 i7-1280P OLED
Samsung 134XK04, OLED, 3456×2160, 13.40
Samsung Galaxy Book2 Pro 13 NP930XED-KA1DE
ATNA33XC10-0, OLED, 1920×1080, 13.30
Display

0%

-4%

-21%

1%

-0%

Display P3 Coverage

99.7

99.8

0%

98.4

-1%

67.3

-32%

99.5

0%

99.81

0%

sRGB Coverage

100

100

0%

99.9

0%

98.9

-1%

100

0%

100

0%

AdobeRGB 1998 Coverage

96.9

97.8

1%

87.6

-10%

69.1

-29%

98.4

2%

95.55

-1%

Response Times

-3%

-1501%

-1310%

-45%

-67%

Response Time Grey 50% / Grey 80% *

2

The preinstalled MyAsus app offers various color profiles, which we measured with the professional CalMAN software. By default, the “Native” profile is activated, which reproduces the colors slightly too saturated, making the image subjectively appear a bit more vibrant. In addition, with Display-P3 and sRGB there are also two extremely accurate profiles if you want to work on images in the corresponding color spaces. These two profiles are already extremely well calibrated in the state of delivery, so that we were unable to further improve the display with our own calibration. Together with the almost complete P3 color space coverage, this is an excellent performance overall.

Display Response Times

       Response Time Black to White
1.6 ms … rise ↗ and fall ↘ combined↗ 0.8 ms rise
↘ 0.8 ms fall
The screen shows very fast response rates in our tests and should be very well suited for fast-paced gaming.
In comparison, all tested devices range from 0.4 (minimum) to 240 (maximum) ms. » 2 % of all devices are better.
This means that the measured response time is better than the average of all tested devices (22.4 ms).
       Response Time 50% Grey to 80% Grey
2 ms … rise ↗ and fall ↘ combined↗ 1.1 ms rise
↘ 0.9 ms fall
The screen shows very fast response rates in our tests and should be very well suited for fast-paced gaming.
In comparison, all tested devices range from 0.25 (minimum) to 636 (maximum) ms. » 3 % of all devices are better.
This means that the measured response time is better than the average of all tested devices (35.5 ms).

Screen Flickering / PWM (Pulse-Width Modulation)

Screen flickering / PWM detected 240 Hz ≤ 57 % brightness setting
≤ 88 cd/m² brightness

The display backlight flickers at 240 Hz (Likely utilizing PWM) Flickering detected at a brightness setting of 57 % (88 cd/m²) and below. There should be no flickering or PWM above this brightness setting.

The frequency of 240 Hz is relatively low, so sensitive users will likely notice flickering and experience eyestrain at the stated brightness setting and below.

Flickering occurs at relatively low brightness settings, so extended use at this brightness setting or lower can cause eyestrain.

In comparison: 53 % of all tested devices do not use PWM to dim the display. If PWM was detected, an average of 18986 (minimum: 5 – maximum: 3846000) Hz was measured.

As soon as you go below the Windows brightness of 60%, a warning notification pops up.

Asus continues to offer a software solution to reduce the brightness without getting into the harmful PWM area. Asus calls this function “flicker free OLED darkening,” allowing you to continue to reduce the brightness in steps. In practice, you shouldn’t go below the Windows brightness of 60%, and for an additional reduction, use the software instead. Even though Asus provides a warning notification here, we would have of course preferred a more comfortable solution, where the software method is directly integrated into the Windows settings and the user wouldn’t be able to get into the classic PWM area at all.

As examples, we measured several settings with the two basic brightness settings and various darkening levels. You can clearly see that you can also implement lower brightness levels with the DC dimming by using the software darkening.

Outdoors, the Zenbook benefits from the extremely high contrast, but it still uses a reflective screen, which will necessarily lead to some reflections. A higher SDR brightness surely would also be of some benefit here. The viewing angle stability is very good overall, and you can only see the slight blue tint that is typical for OLED panels from some certain (very steep) viewing angles.

Viewing angle stability

Asus offers three different performance profiles: Whisper mode, Standard mode, and Performance mode. Due to its loud fans (without bringing a noticeable performance increase), the latter disqualifies itself from being used. We ran our benchmarks and measurements below in Standard mode. When using Whisper mode, the fans are significantly quieter, but this isn’t necessarily an advantage with the high-frequency fan noise. But more on this later.

The Intel Core i7-1355U from the current Raptor Lake generation offers two fast Performance and eight Efficiency cores. Basically, this is last year’s Alder Lake Core i7-1255U with slightly elevated clock speeds. The processor is allowed to consume up to 44 watts for short time periods, but under constant load, the consumption quickly drops to about 17 watts.

In the multicore tests, the performance is therefore only competitive for a short time, and the passively cooled MacBook Air M2, for example, is already faster in the second run (even though Cinebench R15 has to be emulated here). Compared to last year’s Zenbook S 13 with the Ryzen 7 6800U, the multicore performance is also significantly worse. Only in the single-core tests do we see a slight advantage of 20% at most, compared to the Ryzen 7 6800U. But across all CPU benchmarks, the new model still places 10% behind the Zenbook S 13 from last year. 

In battery operation, the power consumption is reduced slightly further, and the multicore performance drops by about 17%. On the other hand, the 3% reduction of the single-core performance is negligible. You can find additional CPU benchmarks here.

01002003004005006007008009001000110012001300140015001600170018001900Tooltip
CPU measurements during the Cinebench R15 multi loop
CPU Performance Rating
Dell XPS 13 Plus 9320 i7-1280P OLED
Intel Core i7-1280P


87.7 pt ∼88%

Lenovo Yoga Slim 7 Carbon 13IAP7-82U9005FGE
Intel Core i7-1260P


82.4 pt ∼82%

Asus Zenbook S 13 OLED
AMD Ryzen 7 6800U


79.8 pt ∼80%

Average Intel Core i7-1355U


77.9 pt ∼78%

Asus ZenBook S13 OLED UX5304
Intel Core i7-1355U


72.7 pt ∼73%

Apple MacBook Air M2 10C GPU -5!
Apple M2


66.3 pt ∼66%

Average of class Subnotebook


64 pt ∼64%

Samsung Galaxy Book2 Pro 13 NP930XED-KA1DE
Intel Core i5-1240P


33.8 pt ∼34%

Cinebench R23 / Multi Core
Dell XPS 13 Plus 9320 i7-1280P OLED
Intel Core i7-1280P


11852 (9209.64min – 11852max) Points ∼100% +69%

Asus Zenbook S 13 OLED
AMD Ryzen 7 6800U


10468 Points ∼88% +49%

Lenovo Yoga Slim 7 Carbon 13IAP7-82U9005FGE
Intel Core i7-1260P


9781 Points ∼83% +39%

Average Intel Core i7-1355U
  (7015 – 10252, n=2)


8634 Points ∼73% +23%

Apple MacBook Air M2 10C GPU
Apple M2


8517 Points ∼72% +21%

Average of class Subnotebook
  (965 – 14917, n=83, last 2 years)


7225 Points ∼61% +3%

Asus ZenBook S13 OLED UX5304
Intel Core i7-1355U


7015 Points ∼59%

Samsung Galaxy Book2 Pro 13 NP930XED-KA1DE
Intel Core i5-1240P


5680 Points ∼48% -19%

Cinebench R23 / Single Core
Average Intel Core i7-1355U
  (1730 – 1825, n=2)


1778 Points ∼100% +3%

Lenovo Yoga Slim 7 Carbon 13IAP7-82U9005FGE
Intel Core i7-1260P


1755 Points ∼99% +1%

Asus ZenBook S13 OLED UX5304
Intel Core i7-1355U


1730 Points ∼97%

Dell XPS 13 Plus 9320 i7-1280P OLED
Intel Core i7-1280P


1615 Points ∼91% -7%

Apple MacBook Air M2 10C GPU
Apple M2


1580 Points ∼89% -9%

Asus Zenbook S 13 OLED
AMD Ryzen 7 6800U


1488 Points ∼84% -14%

Average of class Subnotebook
  (409 – 1796, n=84, last 2 years)


1417 Points ∼80% -18%

Samsung Galaxy Book2 Pro 13 NP930XED-KA1DE
Intel Core i5-1240P


640 Points ∼36% -63%

Cinebench R20 / CPU (Multi Core)
Dell XPS 13 Plus 9320 i7-1280P OLED
Intel Core i7-1280P


4571 Points ∼100% +60%

Asus Zenbook S 13 OLED
AMD Ryzen 7 6800U


4060 Points ∼89% +43%

Lenovo Yoga Slim 7 Carbon 13IAP7-82U9005FGE
Intel Core i7-1260P


3766 Points ∼82% +32%

Average Intel Core i7-1355U
  (2849 – 3907, n=2)


3378 Points ∼74% +19%

Asus ZenBook S13 OLED UX5304
Intel Core i7-1355U


2849 Points ∼62%

Average of class Subnotebook
  (376 – 5762, n=83, last 2 years)


2785 Points ∼61% -2%

Apple MacBook Air M2 10C GPU
Apple M2


2306 Points ∼50% -19%

Samsung Galaxy Book2 Pro 13 NP930XED-KA1DE
Intel Core i5-1240P


2178 Points ∼48% -24%

Cinebench R20 / CPU (Single Core)
Average Intel Core i7-1355U
  (679 – 708, n=2)


694 Points ∼100% +2%

Asus ZenBook S13 OLED UX5304
Intel Core i7-1355U


679 Points ∼98%

Lenovo Yoga Slim 7 Carbon 13IAP7-82U9005FGE
Intel Core i7-1260P


676 Points ∼97% 0%

Dell XPS 13 Plus 9320 i7-1280P OLED
Intel Core i7-1280P


622 Points ∼90% -8%

Asus Zenbook S 13 OLED
AMD Ryzen 7 6800U


564 Points ∼81% -17%

Average of class Subnotebook
  (159 – 701, n=84, last 2 years)


540 Points ∼78% -20%

Apple MacBook Air M2 10C GPU
Apple M2


380 Points ∼55% -44%

Samsung Galaxy Book2 Pro 13 NP930XED-KA1DE
Intel Core i5-1240P


251 Points ∼36% -63%

Cinebench R15 / CPU Multi 64Bit
Dell XPS 13 Plus 9320 i7-1280P OLED
Intel Core i7-1280P


1905 (1369.16min – 1905.49max) Points ∼100% +40%

Lenovo Yoga Slim 7 Carbon 13IAP7-82U9005FGE
Intel Core i7-1260P


1803 (1365.51min – 1802.61max) Points ∼95% +33%

Asus Zenbook S 13 OLED
AMD Ryzen 7 6800U


1742 Points ∼91% +28%

Average Intel Core i7-1355U
  (1358 – 1735, n=2)


1547 Points ∼81% +14%

Asus ZenBook S13 OLED UX5304
Intel Core i7-1355U


1358 (989.63min – 1358.19max) Points ∼71%

Average of class Subnotebook
  (234 – 2174, n=89, last 2 years)


1247 Points ∼65% -8%

Apple MacBook Air M2 10C GPU
Apple M2


1212 (917min – 1212max) Points ∼64% -11%

Samsung Galaxy Book2 Pro 13 NP930XED-KA1DE
Intel Core i5-1240P


884 (859.75min – 883.65max) Points ∼46% -35%

Cinebench R15 / CPU Single 64Bit
Average Intel Core i7-1355U
  (245 – 257, n=2)


251 Points ∼100% +2%

Asus ZenBook S13 OLED UX5304
Intel Core i7-1355U


245 Points ∼98%

Lenovo Yoga Slim 7 Carbon 13IAP7-82U9005FGE
Intel Core i7-1260P


242 Points ∼96% -1%

Asus Zenbook S 13 OLED
AMD Ryzen 7 6800U


237 Points ∼94% -3%

Dell XPS 13 Plus 9320 i7-1280P OLED
Intel Core i7-1280P


229 Points ∼91% -7%

Apple MacBook Air M2 10C GPU
Apple M2


223 Points ∼89% -9%

Average of class Subnotebook
  (74.5 – 263, n=80, last 2 years)


209 Points ∼83% -15%

Samsung Galaxy Book2 Pro 13 NP930XED-KA1DE
Intel Core i5-1240P


91.8 Points ∼37% -63%

Blender / v2.79 BMW27 CPU
Apple MacBook Air M2 10C GPU
Apple M2


616.7 Seconds * ∼100% -37%

Samsung Galaxy Book2 Pro 13 NP930XED-KA1DE
Intel Core i5-1240P


559 Seconds * ∼91% -24%

Average of class Subnotebook
  (231 – 2583, n=83, last 2 years)


541 Seconds * ∼88% -20%

Asus ZenBook S13 OLED UX5304
Intel Core i7-1355U


450 Seconds * ∼73%

Asus ZenBook S13 OLED UX5304
Intel Core i7-1355U


448 Seconds * ∼73% -0%

Average Intel Core i7-1355U
  (349 – 450, n=3)


416 Seconds * ∼67% +8%

Lenovo Yoga Slim 7 Carbon 13IAP7-82U9005FGE
Intel Core i7-1260P


334 Seconds * ∼54% +26%

Asus Zenbook S 13 OLED
AMD Ryzen 7 6800U


310 Seconds * ∼50% +31%

Dell XPS 13 Plus 9320 i7-1280P OLED
Intel Core i7-1280P


268 Seconds * ∼43% +40%

7-Zip 18.03 / 7z b 4
Dell XPS 13 Plus 9320 i7-1280P OLED
Intel Core i7-1280P


49572 MIPS ∼100% +59%

Asus Zenbook S 13 OLED
AMD Ryzen 7 6800U


47500 MIPS ∼96% +52%

Lenovo Yoga Slim 7 Carbon 13IAP7-82U9005FGE
Intel Core i7-1260P


40577 MIPS ∼82% +30%

Average Intel Core i7-1355U
  (31233 – 40711, n=2)


35972 MIPS ∼73% +15%

Average of class Subnotebook
  (7436 – 58804, n=78, last 2 years)


32039 MIPS ∼65% +3%

Asus ZenBook S13 OLED UX5304
Intel Core i7-1355U


31233 MIPS ∼63%

Samsung Galaxy Book2 Pro 13 NP930XED-KA1DE
Intel Core i5-1240P


23132 MIPS ∼47% -26%

7-Zip 18.03 / 7z b 4 -mmt1
Asus ZenBook S13 OLED UX5304
Intel Core i7-1355U


5689 MIPS ∼100%

Average Intel Core i7-1355U
  (5651 – 5689, n=2)


5670 MIPS ∼100% 0%

Asus Zenbook S 13 OLED
AMD Ryzen 7 6800U


5431 MIPS ∼95% -5%

Lenovo Yoga Slim 7 Carbon 13IAP7-82U9005FGE
Intel Core i7-1260P


5407 MIPS ∼95% -5%

Dell XPS 13 Plus 9320 i7-1280P OLED
Intel Core i7-1280P


4995 MIPS ∼88% -12%

Average of class Subnotebook
  (2197 – 5833, n=78, last 2 years)


4941 MIPS ∼87% -13%

Samsung Galaxy Book2 Pro 13 NP930XED-KA1DE
Intel Core i5-1240P


2197 MIPS ∼39% -61%

Geekbench 5.4 / Multi-Core
Dell XPS 13 Plus 9320 i7-1280P OLED
Intel Core i7-1280P


11434 Points ∼100% +41%

Lenovo Yoga Slim 7 Carbon 13IAP7-82U9005FGE
Intel Core i7-1260P


9555 Points ∼84% +18%

Apple MacBook Air M2 10C GPU
Apple M2


8991 Points ∼79% +11%

Average Intel Core i7-1355U
  (8117 – 9159, n=2)


8638 Points ∼76% +6%

Asus ZenBook S13 OLED UX5304
Intel Core i7-1355U


8117 Points ∼71%

Asus Zenbook S 13 OLED
AMD Ryzen 7 6800U


7613 Points ∼67% -6%

Average of class Subnotebook
  (2972 – 11434, n=74, last 2 years)


6619 Points ∼58% -18%

Samsung Galaxy Book2 Pro 13 NP930XED-KA1DE
Intel Core i5-1240P


4819 Points ∼42% -41%

Geekbench 5.4 / Single-Core
Apple MacBook Air M2 10C GPU
Apple M2


1925 Points ∼100% +8%

Dell XPS 13 Plus 9320 i7-1280P OLED
Intel Core i7-1280P


1802 Points ∼94% +2%

Asus ZenBook S13 OLED UX5304
Intel Core i7-1355U


1775 Points ∼92%

Average Intel Core i7-1355U
  (1751 – 1775, n=2)


1763 Points ∼92% -1%

Lenovo Yoga Slim 7 Carbon 13IAP7-82U9005FGE
Intel Core i7-1260P


1728 Points ∼90% -3%

Asus Zenbook S 13 OLED
AMD Ryzen 7 6800U


1514 Points ∼79% -15%

Average of class Subnotebook
  (672 – 1937, n=74, last 2 years)


1499 Points ∼78% -16%

Samsung Galaxy Book2 Pro 13 NP930XED-KA1DE
Intel Core i5-1240P


672 Points ∼35% -62%

HWBOT x265 Benchmark v2.2 / 4k Preset
Dell XPS 13 Plus 9320 i7-1280P OLED
Intel Core i7-1280P


13.8 fps ∼100% +76%

Asus Zenbook S 13 OLED
AMD Ryzen 7 6800U


12.6 fps ∼91% +61%

Lenovo Yoga Slim 7 Carbon 13IAP7-82U9005FGE
Intel Core i7-1260P


11.2 fps ∼81% +43%

Average Intel Core i7-1355U
  (7.83 – 10.6, n=2)


9.22 fps ∼67% +18%

Average of class Subnotebook
  (1.02 – 16.4, n=74, last 2 years)


8.65 fps ∼63% +10%

Asus ZenBook S13 OLED UX5304
Intel Core i7-1355U


7.83 fps ∼57%

Samsung Galaxy Book2 Pro 13 NP930XED-KA1DE
Intel Core i5-1240P


6.92 fps ∼50% -12%

LibreOffice / 20 Documents To PDF
Samsung Galaxy Book2 Pro 13 NP930XED-KA1DE
Intel Core i5-1240P


120.5 s * ∼100% -154%

Average of class Subnotebook
  (40.1 – 157, n=77, last 2 years)


56.1 s * ∼47% -18%

Asus Zenbook S 13 OLED
AMD Ryzen 7 6800U


54.1 s * ∼45% -14%

Dell XPS 13 Plus 9320 i7-1280P OLED
Intel Core i7-1280P


49.2 s * ∼41% -4%

Asus ZenBook S13 OLED UX5304
Intel Core i7-1355U


47.5 s * ∼39%

Average Intel Core i7-1355U
  (45.3 – 47.5, n=2)


46.4 s * ∼39% +2%

Lenovo Yoga Slim 7 Carbon 13IAP7-82U9005FGE
Intel Core i7-1260P


44.6 s * ∼37% +6%

R Benchmark 2.5 / Overall mean
Samsung Galaxy Book2 Pro 13 NP930XED-KA1DE
Intel Core i5-1240P


1.236 sec * ∼100% -164%

Average of class Subnotebook
  (0.4587 – 1.649, n=77, last 2 years)


0.598 sec * ∼48% -28%

Asus Zenbook S 13 OLED
AMD Ryzen 7 6800U


0.529 sec * ∼43% -13%

Dell XPS 13 Plus 9320 i7-1280P OLED
Intel Core i7-1280P


0.4998 sec * ∼40% -7%

Lenovo Yoga Slim 7 Carbon 13IAP7-82U9005FGE
Intel Core i7-1260P


0.4734 sec * ∼38% -1%

Asus ZenBook S13 OLED UX5304
Intel Core i7-1355U


0.469 sec * ∼38%

Average Intel Core i7-1355U
  (0.4593 – 0.469, n=2)


0.4642 sec * ∼38% +1%

* … smaller is better

Cinebench R10 Rendering Multiple CPUs 32Bit

33627

Cinebench R10 Shading 32Bit

13939

Cinebench R10 Rendering Single 32Bit

10028

Cinebench R11.5 CPU Multi 64Bit

16.45 Points

Cinebench R11.5 OpenGL 64Bit

80.32 fps

Cinebench R11.5 CPU Single 64Bit

3.07 Points

Cinebench R15 CPU Single 64Bit

245 Points

Cinebench R15 Ref. Match 64Bit

97.8 %

Cinebench R15 OpenGL 64Bit

94.8 fps

Cinebench R15 CPU Multi 64Bit

1358 Points

Help

Performance Rating
Asus Zenbook S 13 OLED
AMD Ryzen 7 6800U, Radeon 680M


91.6 pt ∼92%

Dell XPS 13 Plus 9320 i7-1280P OLED
Intel Core i7-1280P, Iris Xe G7 96EUs


86.7 pt ∼87%

Average of class Subnotebook


62.2 pt ∼62%

Average Intel Core i7-1355U


60.3 pt ∼60%

Lenovo Yoga Slim 7 Carbon 13IAP7-82U9005FGE
Intel Core i7-1260P, Iris Xe G7 96EUs


56.4 pt ∼56%

Asus ZenBook S13 OLED UX5304
Intel Core i7-1355U, Iris Xe G7 96EUs


53.9 pt ∼54%

Samsung Galaxy Book2 Pro 13 NP930XED-KA1DE
Intel Core i5-1240P, Iris Xe G7 80EUs


32.1 pt ∼32%

AIDA64 / FP32 Ray-Trace
Asus Zenbook S 13 OLED
AMD Ryzen 7 6800U, Radeon 680M


11187 KRay/s ∼100% +87%

Dell XPS 13 Plus 9320 i7-1280P OLED
Intel Core i7-1280P, Iris Xe G7 96EUs


10787 KRay/s ∼96% +80%

Average of class Subnotebook
  (343 – 15660, n=75, last 2 years)


7570 KRay/s ∼68% +27%

Average Intel Core i7-1355U
  (5981 – 7486, n=2)


6734 KRay/s ∼60% +13%

Asus ZenBook S13 OLED UX5304
Intel Core i7-1355U, Iris Xe G7 96EUs


5981 KRay/s ∼53%

Lenovo Yoga Slim 7 Carbon 13IAP7-82U9005FGE
Intel Core i7-1260P, Iris Xe G7 96EUs


5153 KRay/s ∼46% -14%

Samsung Galaxy Book2 Pro 13 NP930XED-KA1DE
Intel Core i5-1240P, Iris Xe G7 80EUs


2882 KRay/s ∼26% -52%

AIDA64 / FPU Julia
Asus Zenbook S 13 OLED
AMD Ryzen 7 6800U, Radeon 680M


71474 Points ∼100% +130%

Dell XPS 13 Plus 9320 i7-1280P OLED
Intel Core i7-1280P, Iris Xe G7 96EUs


56649 Points ∼79% +82%

Average of class Subnotebook
  (5668 – 97744, n=75, last 2 years)


39272 Points ∼55% +26%

Average Intel Core i7-1355U
  (31092 – 40675, n=2)


35884 Points ∼50% +15%

Asus ZenBook S13 OLED UX5304
Intel Core i7-1355U, Iris Xe G7 96EUs


31092 Points ∼44%

Lenovo Yoga Slim 7 Carbon 13IAP7-82U9005FGE
Intel Core i7-1260P, Iris Xe G7 96EUs


24443 Points ∼34% -21%

Samsung Galaxy Book2 Pro 13 NP930XED-KA1DE
Intel Core i5-1240P, Iris Xe G7 80EUs


12712 Points ∼18% -59%

AIDA64 / CPU SHA3
Dell XPS 13 Plus 9320 i7-1280P OLED
Intel Core i7-1280P, Iris Xe G7 96EUs


2683 MB/s ∼100% +64%

Asus Zenbook S 13 OLED
AMD Ryzen 7 6800U, Radeon 680M


2455 MB/s ∼92% +50%

Average of class Subnotebook
  (355 – 3229, n=75, last 2 years)


1924 MB/s ∼72% +18%

Average Intel Core i7-1355U
  (1632 – 2179, n=2)


1906 MB/s ∼71% +17%

Lenovo Yoga Slim 7 Carbon 13IAP7-82U9005FGE
Intel Core i7-1260P, Iris Xe G7 96EUs


1728 MB/s ∼64% +6%

Asus ZenBook S13 OLED UX5304
Intel Core i7-1355U, Iris Xe G7 96EUs


1632 MB/s ∼61%

Samsung Galaxy Book2 Pro 13 NP930XED-KA1DE
Intel Core i5-1240P, Iris Xe G7 80EUs


1007 MB/s ∼38% -38%

AIDA64 / CPU Queen
Dell XPS 13 Plus 9320 i7-1280P OLED
Intel Core i7-1280P, Iris Xe G7 96EUs


94234 Points ∼100% +42%

Asus Zenbook S 13 OLED
AMD Ryzen 7 6800U, Radeon 680M


82608 Points ∼88% +24%

Lenovo Yoga Slim 7 Carbon 13IAP7-82U9005FGE
Intel Core i7-1260P, Iris Xe G7 96EUs


77209 Points ∼82% +16%

Asus ZenBook S13 OLED UX5304
Intel Core i7-1355U, Iris Xe G7 96EUs


66531 Points ∼71%

Average Intel Core i7-1355U
  (66277 – 66531, n=2)


66404 Points ∼70% 0%

Average of class Subnotebook
  (15447 – 103094, n=75, last 2 years)


62868 Points ∼67% -6%

Samsung Galaxy Book2 Pro 13 NP930XED-KA1DE
Intel Core i5-1240P, Iris Xe G7 80EUs


29405 Points ∼31% -56%

AIDA64 / FPU SinJulia
Asus Zenbook S 13 OLED
AMD Ryzen 7 6800U, Radeon 680M


10724 Points ∼100% +154%

Dell XPS 13 Plus 9320 i7-1280P OLED
Intel Core i7-1280P, Iris Xe G7 96EUs


7547 Points ∼70% +79%

Average of class Subnotebook
  (1078 – 12607, n=75, last 2 years)


6225 Points ∼58% +48%

Lenovo Yoga Slim 7 Carbon 13IAP7-82U9005FGE
Intel Core i7-1260P, Iris Xe G7 96EUs


6013 Points ∼56% +43%

Average Intel Core i7-1355U
  (4216 – 5113, n=2)


4665 Points ∼44% +11%

Asus ZenBook S13 OLED UX5304
Intel Core i7-1355U, Iris Xe G7 96EUs


4216 Points ∼39%

Samsung Galaxy Book2 Pro 13 NP930XED-KA1DE
Intel Core i5-1240P, Iris Xe G7 80EUs


2925 Points ∼27% -31%

AIDA64 / FPU Mandel
Asus Zenbook S 13 OLED
AMD Ryzen 7 6800U, Radeon 680M


39378 Points ∼100% +159%

Dell XPS 13 Plus 9320 i7-1280P OLED
Intel Core i7-1280P, Iris Xe G7 96EUs


26694 Points ∼68% +75%

Average of class Subnotebook
  (3056 – 53729, n=75, last 2 years)


21904 Points ∼56% +44%

Average Intel Core i7-1355U
  (15222 – 19985, n=2)


17604 Points ∼45% +16%

Asus ZenBook S13 OLED UX5304
Intel Core i7-1355U, Iris Xe G7 96EUs


15222 Points ∼39%

Lenovo Yoga Slim 7 Carbon 13IAP7-82U9005FGE
Intel Core i7-1260P, Iris Xe G7 96EUs


14258 Points ∼36% -6%

Samsung Galaxy Book2 Pro 13 NP930XED-KA1DE
Intel Core i5-1240P, Iris Xe G7 80EUs


8608 Points ∼22% -43%

AIDA64 / CPU AES
Asus Zenbook S 13 OLED
AMD Ryzen 7 6800U, Radeon 680M


101595 MB/s ∼100% +211%

Average of class Subnotebook
  (638 – 121917, n=75, last 2 years)


56835 MB/s ∼56% +74%

Dell XPS 13 Plus 9320 i7-1280P OLED
Intel Core i7-1280P, Iris Xe G7 96EUs


54261 MB/s ∼53% +66%

Average Intel Core i7-1355U
  (32647 – 42670, n=2)


37659 MB/s ∼37% +15%

Lenovo Yoga Slim 7 Carbon 13IAP7-82U9005FGE
Intel Core i7-1260P, Iris Xe G7 96EUs


37570 MB/s ∼37% +15%

Asus ZenBook S13 OLED UX5304
Intel Core i7-1355U, Iris Xe G7 96EUs


32647 MB/s ∼32%

Samsung Galaxy Book2 Pro 13 NP930XED-KA1DE
Intel Core i5-1240P, Iris Xe G7 80EUs


20443 MB/s ∼20% -37%

AIDA64 / CPU ZLib
Dell XPS 13 Plus 9320 i7-1280P OLED
Intel Core i7-1280P, Iris Xe G7 96EUs


725 MB/s ∼100% +49%

Asus Zenbook S 13 OLED
AMD Ryzen 7 6800U, Radeon 680M


630 MB/s ∼87% +29%

Lenovo Yoga Slim 7 Carbon 13IAP7-82U9005FGE
Intel Core i7-1260P, Iris Xe G7 96EUs


620 MB/s ∼86% +27%

Average Intel Core i7-1355U
  (488 – 684, n=2)


586 MB/s ∼81% +20%

Asus ZenBook S13 OLED UX5304
Intel Core i7-1355U, Iris Xe G7 96EUs


488 MB/s ∼67%

Average of class Subnotebook
  (117 – 962, n=76, last 2 years)


472 MB/s ∼65% -3%

Samsung Galaxy Book2 Pro 13 NP930XED-KA1DE
Intel Core i5-1240P, Iris Xe G7 80EUs


362 MB/s ∼50% -26%

AIDA64 / FP64 Ray-Trace
Dell XPS 13 Plus 9320 i7-1280P OLED
Intel Core i7-1280P, Iris Xe G7 96EUs


5993 KRay/s ∼100% +91%

Asus Zenbook S 13 OLED
AMD Ryzen 7 6800U, Radeon 680M


5825 KRay/s ∼97% +86%

Average of class Subnotebook
  (204 – 7412, n=75, last 2 years)


3967 KRay/s ∼66% +27%

Average Intel Core i7-1355U
  (3134 – 4016, n=2)


3575 KRay/s ∼60% +14%

Asus ZenBook S13 OLED UX5304
Intel Core i7-1355U, Iris Xe G7 96EUs


3134 KRay/s ∼52%

Lenovo Yoga Slim 7 Carbon 13IAP7-82U9005FGE
Intel Core i7-1260P, Iris Xe G7 96EUs


2898 KRay/s ∼48% -8%

Samsung Galaxy Book2 Pro 13 NP930XED-KA1DE
Intel Core i5-1240P, Iris Xe G7 80EUs


1816 KRay/s ∼30% -42%

AIDA64 / CPU PhotoWorxx
Dell XPS 13 Plus 9320 i7-1280P OLED
Intel Core i7-1280P, Iris Xe G7 96EUs


47506 MPixel/s ∼100% +23%

Average Intel Core i7-1355U
  (38665 – 42678, n=2)


40672 MPixel/s ∼86% +5%

Asus ZenBook S13 OLED UX5304
Intel Core i7-1355U, Iris Xe G7 96EUs


38665 MPixel/s ∼81%

Lenovo Yoga Slim 7 Carbon 13IAP7-82U9005FGE
Intel Core i7-1260P, Iris Xe G7 96EUs


35173 MPixel/s ∼74% -9%

Average of class Subnotebook
  (6569 – 48416, n=75, last 2 years)


28640 MPixel/s ∼60% -26%

Samsung Galaxy Book2 Pro 13 NP930XED-KA1DE
Intel Core i5-1240P, Iris Xe G7 80EUs


28249 MPixel/s ∼59% -27%

Asus Zenbook S 13 OLED
AMD Ryzen 7 6800U, Radeon 680M


25037 MPixel/s ∼53% -35%

The subjective performance impression of the new Zenbook S 13 is very good, and all inputs are implemented without any noticeable delays. The results in the synthetic benchmarks are average and in parts remain even behind those of the predecessor. However, nothing of this is noticeable in practice.

PCMark 10 / Score
Asus Zenbook S 13 OLED
Radeon 680M, R7 6800U, Samsung PM9A1 MZVL21T0HCLR


6346 Points ∼100% +14%

Average Intel Core i7-1355U, Intel Iris Xe Graphics G7 96EUs
  (5576 – 5933, n=2)


5755 Points ∼91% +3%

Dell XPS 13 Plus 9320 i7-1280P OLED
Iris Xe G7 96EUs, i7-1280P, WDC PC SN810 512GB


5644 Points ∼89% +1%

Lenovo Yoga Slim 7 Carbon 13IAP7-82U9005FGE
Iris Xe G7 96EUs, i7-1260P, Samsung PM9A1 MZVL21T0HCLR


5598 Points ∼88% 0%

Asus ZenBook S13 OLED UX5304
Iris Xe G7 96EUs, i7-1355U, Samsung PM9A1 MZVL21T0HCLR


5576 Points ∼88%

Average of class Subnotebook
  (1671 – 6767, n=74, last 2 years)


5220 Points ∼82% -6%

Samsung Galaxy Book2 Pro 13 NP930XED-KA1DE
Iris Xe G7 80EUs, i5-1240P, Samsung PM991a MZVLQ256HBJD


4881 Points ∼77% -12%

PCMark 10 / Essentials
Average Intel Core i7-1355U, Intel Iris Xe Graphics G7 96EUs
  (10605 – 11822, n=2)


11214 Points ∼100% +6%

Asus Zenbook S 13 OLED
Radeon 680M, R7 6800U, Samsung PM9A1 MZVL21T0HCLR


10709 Points ∼95% +1%

Asus ZenBook S13 OLED UX5304
Iris Xe G7 96EUs, i7-1355U, Samsung PM9A1 MZVL21T0HCLR


10605 Points ∼95%

Lenovo Yoga Slim 7 Carbon 13IAP7-82U9005FGE
Iris Xe G7 96EUs, i7-1260P, Samsung PM9A1 MZVL21T0HCLR


10555 Points ∼94% 0%

Dell XPS 13 Plus 9320 i7-1280P OLED
Iris Xe G7 96EUs, i7-1280P, WDC PC SN810 512GB


10435 Points ∼93% -2%

Average of class Subnotebook
  (4599 – 10836, n=74, last 2 years)


9698 Points ∼86% -9%

Samsung Galaxy Book2 Pro 13 NP930XED-KA1DE
Iris Xe G7 80EUs, i5-1240P, Samsung PM991a MZVLQ256HBJD


9494 Points ∼85% -10%

PCMark 10 / Productivity
Asus Zenbook S 13 OLED
Radeon 680M, R7 6800U, Samsung PM9A1 MZVL21T0HCLR


8984 Points ∼100% +25%

Average of class Subnotebook
  (2833 – 9852, n=74, last 2 years)


7258 Points ∼81% +1%

Average Intel Core i7-1355U, Intel Iris Xe Graphics G7 96EUs
  (7182 – 7197, n=2)


7190 Points ∼80% 0%

Asus ZenBook S13 OLED UX5304
Iris Xe G7 96EUs, i7-1355U, Samsung PM9A1 MZVL21T0HCLR


7182 Points ∼80%

Dell XPS 13 Plus 9320 i7-1280P OLED
Iris Xe G7 96EUs, i7-1280P, WDC PC SN810 512GB


6698 Points ∼75% -7%

Lenovo Yoga Slim 7 Carbon 13IAP7-82U9005FGE
Iris Xe G7 96EUs, i7-1260P, Samsung PM9A1 MZVL21T0HCLR


6692 Points ∼74% -7%

Samsung Galaxy Book2 Pro 13 NP930XED-KA1DE
Iris Xe G7 80EUs, i5-1240P, Samsung PM991a MZVLQ256HBJD


6430 Points ∼72% -10%

PCMark 10 / Digital Content Creation
Asus Zenbook S 13 OLED
Radeon 680M, R7 6800U, Samsung PM9A1 MZVL21T0HCLR


7208 Points ∼100% +17%

Dell XPS 13 Plus 9320 i7-1280P OLED
Iris Xe G7 96EUs, i7-1280P, WDC PC SN810 512GB


6983 Points ∼97% +13%

Lenovo Yoga Slim 7 Carbon 13IAP7-82U9005FGE
Iris Xe G7 96EUs, i7-1260P, Samsung PM9A1 MZVL21T0HCLR


6740 Points ∼94% +9%

Average Intel Core i7-1355U, Intel Iris Xe Graphics G7 96EUs
  (6177 – 6663, n=2)


6420 Points ∼89% +4%

Asus ZenBook S13 OLED UX5304
Iris Xe G7 96EUs, i7-1355U, Samsung PM9A1 MZVL21T0HCLR


6177 Points ∼86%

Average of class Subnotebook
  (973 – 8855, n=74, last 2 years)


5557 Points ∼77% -10%

Samsung Galaxy Book2 Pro 13 NP930XED-KA1DE
Iris Xe G7 80EUs, i5-1240P, Samsung PM991a MZVLQ256HBJD


5169 Points ∼72% -16%

CrossMark / Overall
Dell XPS 13 Plus 9320 i7-1280P OLED
Iris Xe G7 96EUs, i7-1280P, WDC PC SN810 512GB


1747 Points ∼100% +10%

Lenovo Yoga Slim 7 Carbon 13IAP7-82U9005FGE
Iris Xe G7 96EUs, i7-1260P, Samsung PM9A1 MZVL21T0HCLR


1613 Points ∼92% +1%

Average Intel Core i7-1355U, Intel Iris Xe Graphics G7 96EUs
  (1592 – 1623, n=2)


1608 Points ∼92% +1%

Asus ZenBook S13 OLED UX5304
Iris Xe G7 96EUs, i7-1355U, Samsung PM9A1 MZVL21T0HCLR


1592 Points ∼91%

Apple MacBook Air M2 10C GPU
M2 10-Core GPU, M2, Apple SSD AP1024Z


1496 Points ∼86% -6%

Asus Zenbook S 13 OLED
Radeon 680M, R7 6800U, Samsung PM9A1 MZVL21T0HCLR


1481 Points ∼85% -7%

Average of class Subnotebook
  (718 – 1811, n=44, last 2 years)


1417 Points ∼81% -11%

CrossMark / Productivity
Dell XPS 13 Plus 9320 i7-1280P OLED
Iris Xe G7 96EUs, i7-1280P, WDC PC SN810 512GB


1658 Points ∼100% +6%

Average Intel Core i7-1355U, Intel Iris Xe Graphics G7 96EUs
  (1566 – 1595, n=2)


1581 Points ∼95% +1%

Asus ZenBook S13 OLED UX5304
Iris Xe G7 96EUs, i7-1355U, Samsung PM9A1 MZVL21T0HCLR


1566 Points ∼94%

Lenovo Yoga Slim 7 Carbon 13IAP7-82U9005FGE
Iris Xe G7 96EUs, i7-1260P, Samsung PM9A1 MZVL21T0HCLR


1541 Points ∼93% -2%

Asus Zenbook S 13 OLED
Radeon 680M, R7 6800U, Samsung PM9A1 MZVL21T0HCLR


1476 Points ∼89% -6%

Average of class Subnotebook
  (685 – 1755, n=44, last 2 years)


1406 Points ∼85% -10%

Apple MacBook Air M2 10C GPU
M2 10-Core GPU, M2, Apple SSD AP1024Z


1377 Points ∼83% -12%

CrossMark / Creativity
Dell XPS 13 Plus 9320 i7-1280P OLED
Iris Xe G7 96EUs, i7-1280P, WDC PC SN810 512GB


1928 Points ∼100% +14%

Apple MacBook Air M2 10C GPU
M2 10-Core GPU, M2, Apple SSD AP1024Z


1819 Points ∼94% +7%

Lenovo Yoga Slim 7 Carbon 13IAP7-82U9005FGE
Iris Xe G7 96EUs, i7-1260P, Samsung PM9A1 MZVL21T0HCLR


1794 Points ∼93% +6%

Average Intel Core i7-1355U, Intel Iris Xe Graphics G7 96EUs
  (1696 – 1727, n=2)


1712 Points ∼89% +1%

Asus ZenBook S13 OLED UX5304
Iris Xe G7 96EUs, i7-1355U, Samsung PM9A1 MZVL21T0HCLR


1696 Points ∼88%

Asus Zenbook S 13 OLED
Radeon 680M, R7 6800U, Samsung PM9A1 MZVL21T0HCLR


1554 Points ∼81% -8%

Average of class Subnotebook
  (776 – 1928, n=44, last 2 years)


1495 Points ∼78% -12%

CrossMark / Responsiveness
Dell XPS 13 Plus 9320 i7-1280P OLED
Iris Xe G7 96EUs, i7-1280P, WDC PC SN810 512GB


1520 Points ∼100% +10%

Average Intel Core i7-1355U, Intel Iris Xe Graphics G7 96EUs
  (1386 – 1418, n=2)


1402 Points ∼92% +1%

Asus ZenBook S13 OLED UX5304
Iris Xe G7 96EUs, i7-1355U, Samsung PM9A1 MZVL21T0HCLR


1386 Points ∼91%

Lenovo Yoga Slim 7 Carbon 13IAP7-82U9005FGE
Iris Xe G7 96EUs, i7-1260P, Samsung PM9A1 MZVL21T0HCLR


1347 Points ∼89% -3%

Asus Zenbook S 13 OLED
Radeon 680M, R7 6800U, Samsung PM9A1 MZVL21T0HCLR


1293 Points ∼85% -7%

Average of class Subnotebook
  (652 – 1815, n=44, last 2 years)


1248 Points ∼82% -10%

Apple MacBook Air M2 10C GPU
M2 10-Core GPU, M2, Apple SSD AP1024Z


1065 Points ∼70% -23%

PCMark 10 Score5576 points

Help

AIDA64 / Memory Copy
Dell XPS 13 Plus 9320 i7-1280P OLED
Intel Core i7-1280P, Iris Xe G7 96EUs


72478 MB/s ∼100% +21%

Average Intel Core i7-1355U
  (59942 – 62918, n=2)


61430 MB/s ∼85% +2%

Asus ZenBook S13 OLED UX5304
Intel Core i7-1355U, Iris Xe G7 96EUs


59942 MB/s ∼83%

Lenovo Yoga Slim 7 Carbon 13IAP7-82U9005FGE
Intel Core i7-1260P, Iris Xe G7 96EUs


58527 MB/s ∼81% -2%

Samsung Galaxy Book2 Pro 13 NP930XED-KA1DE
Intel Core i5-1240P, Iris Xe G7 80EUs


56136 MB/s ∼77% -6%

Average of class Subnotebook
  (12783 – 73486, n=75, last 2 years)


49308 MB/s ∼68% -18%

Asus Zenbook S 13 OLED
AMD Ryzen 7 6800U, Radeon 680M


47701 MB/s ∼66% -20%

AIDA64 / Memory Read
Dell XPS 13 Plus 9320 i7-1280P OLED
Intel Core i7-1280P, Iris Xe G7 96EUs


73719 MB/s ∼100% +48%

Lenovo Yoga Slim 7 Carbon 13IAP7-82U9005FGE
Intel Core i7-1260P, Iris Xe G7 96EUs


64589 MB/s ∼88% +30%

Samsung Galaxy Book2 Pro 13 NP930XED-KA1DE
Intel Core i5-1240P, Iris Xe G7 80EUs


55226 MB/s ∼75% +11%

Average Intel Core i7-1355U
  (49758 – 58380, n=2)


54069 MB/s ∼73% +9%

Average of class Subnotebook
  (10258 – 73719, n=75, last 2 years)


50370 MB/s ∼68% +1%

Asus ZenBook S13 OLED UX5304
Intel Core i7-1355U, Iris Xe G7 96EUs


49758 MB/s ∼67%

Asus Zenbook S 13 OLED
AMD Ryzen 7 6800U, Radeon 680M


39402 MB/s ∼53% -21%

AIDA64 / Memory Write
Average Intel Core i7-1355U
  (72418 – 77448, n=2)


74933 MB/s ∼100% +3%

Asus ZenBook S13 OLED UX5304
Intel Core i7-1355U, Iris Xe G7 96EUs


72418 MB/s ∼97%

Dell XPS 13 Plus 9320 i7-1280P OLED
Intel Core i7-1280P, Iris Xe G7 96EUs


63969 MB/s ∼85% -12%

Lenovo Yoga Slim 7 Carbon 13IAP7-82U9005FGE
Intel Core i7-1260P, Iris Xe G7 96EUs


57649 MB/s ∼77% -20%

Samsung Galaxy Book2 Pro 13 NP930XED-KA1DE
Intel Core i5-1240P, Iris Xe G7 80EUs


54844 MB/s ∼73% -24%

Average of class Subnotebook
  (10533 – 72418, n=75, last 2 years)


50792 MB/s ∼68% -30%

Asus Zenbook S 13 OLED
AMD Ryzen 7 6800U, Radeon 680M


48723 MB/s ∼65% -33%

AIDA64 / Memory Latency
Asus Zenbook S 13 OLED
AMD Ryzen 7 6800U, Radeon 680M


120.1 ns * ∼100% -33%

Lenovo Yoga Slim 7 Carbon 13IAP7-82U9005FGE
Intel Core i7-1260P, Iris Xe G7 96EUs


118.4 ns * ∼99% -31%

Dell XPS 13 Plus 9320 i7-1280P OLED
Intel Core i7-1280P, Iris Xe G7 96EUs


103 ns * ∼86% -14%

Average Intel Core i7-1355U
  (90.1 – 95.5, n=2)


92.8 ns * ∼77% -3%

Average of class Subnotebook
  (18.8 – 126.5, n=71, last 2 years)


91.5 ns * ∼76% -2%

Asus ZenBook S13 OLED UX5304
Intel Core i7-1355U, Iris Xe G7 96EUs


90.1 ns * ∼75%

* … smaller is better

In our standardized latency test (with surfing the Internet, 4K YouTube video reproduction, and CPU load), our test unit with the corresponding BIOS version shows some slight limitations and is therefore not unconditionally suited for using real-time applications.

DPC Latencies / LatencyMon – interrupt to process latency (max), Web, Youtube, Prime95
Samsung Galaxy Book2 Pro 13 NP930XED-KA1DE
Iris Xe G7 80EUs, i5-1240P, Samsung PM991a MZVLQ256HBJD


3228 μs * ∼100% -144%

Asus ZenBook S13 OLED UX5304
Iris Xe G7 96EUs, i7-1355U, Samsung PM9A1 MZVL21T0HCLR


1321.9 μs * ∼41%

Lenovo Yoga Slim 7 Carbon 13IAP7-82U9005FGE
Iris Xe G7 96EUs, i7-1260P, Samsung PM9A1 MZVL21T0HCLR


849.4 μs * ∼26% +36%

Asus Zenbook S 13 OLED
Radeon 680M, R7 6800U, Samsung PM9A1 MZVL21T0HCLR


588.9 μs * ∼18% +55%

Dell XPS 13 Plus 9320 i7-1280P OLED
Iris Xe G7 96EUs, i7-1280P, WDC PC SN810 512GB


461.6 μs * ∼14% +65%

* … smaller is better

Asus has equipped the Zenbook S 13 with a fast PCIe 4.0 SSD from Samsung that offers a storage capacity of 1 TB. After the first start, 903 GB of that remain available to the user for storage. The PM9A1 reaches transfer rates above 7 GB/s, and the constant performance also remains stable for a long time, with only a minimal drop in performance at the end of our constant performance test. Considering the slim case, this is a very good performance. You can find additional SSD benchmarks here.

CDM 5/6 Read Seq Q32T1:
7025 MB/s

CDM 5/6 Write Seq Q32T1:
3931 MB/s

CDM 5/6 Read 4K Q32T1:
435 MB/s

CDM 5/6 Write 4K Q32T1:
355 MB/s

CDM 5/6 Read 4K:
76.9 MB/s

CDM 5/6 Write 4K:
141.4 MB/s

CDM 6 Write 4K Q8T8:
348 MB/s

CDM 6 Read 4K Q8T8:
566 MB/s

Drive Performance Rating – Percent
Average Samsung PM9A1 MZVL21T0HCLR


92.8 pt ∼93%

Asus Zenbook S 13 OLED
Samsung PM9A1 MZVL21T0HCLR


77.7 pt ∼78%

Dell XPS 13 Plus 9320 i7-1280P OLED
WDC PC SN810 512GB


74.9 pt ∼75%

Asus ZenBook S13 OLED UX5304
Samsung PM9A1 MZVL21T0HCLR


73.9 pt ∼74%

Lenovo Yoga Slim 7 Carbon 13IAP7-82U9005FGE
Samsung PM9A1 MZVL21T0HCLR


72.1 pt ∼72%

Average of class Subnotebook


56.6 pt ∼57%

Samsung Galaxy Book2 Pro 13 NP930XED-KA1DE
Samsung PM991a MZVLQ256HBJD


38.6 pt ∼39%

DiskSpd
seq read
Asus ZenBook S13 OLED UX5304
Samsung PM9A1 MZVL21T0HCLR


4001 (3943.69min – 4000.53max) MB/s ∼100%

Dell XPS 13 Plus 9320 i7-1280P OLED
WDC PC SN810 512GB


3747 (3711.67min – 3747.4max) MB/s ∼94% -6%

Lenovo Yoga Slim 7 Carbon 13IAP7-82U9005FGE
Samsung PM9A1 MZVL21T0HCLR


3737 (3696.23min – 3736.65max) MB/s ∼93% -7%

Average Samsung PM9A1 MZVL21T0HCLR
  (1761 – 4634, n=55)


3700 MB/s ∼92% -8%

Asus Zenbook S 13 OLED
Samsung PM9A1 MZVL21T0HCLR


3382 (3242.21min – 3381.81max) MB/s ∼85% -15%

Average of class Subnotebook
  (406 – 4315, n=77, last 2 years)


2304 MB/s ∼58% -42%

Samsung Galaxy Book2 Pro 13 NP930XED-KA1DE
Samsung PM991a MZVLQ256HBJD


1469 (1284.35min – 1469.26max) MB/s ∼37% -63%

seq write
Average Samsung PM9A1 MZVL21T0HCLR
  (2226 – 4516, n=55)


3539 MB/s ∼100% +7%

Dell XPS 13 Plus 9320 i7-1280P OLED
WDC PC SN810 512GB


3470 (3416.05min – 3470.37max) MB/s ∼98% +4%

Asus ZenBook S13 OLED UX5304
Samsung PM9A1 MZVL21T0HCLR


3321 (3143.21min – 3321.26max) MB/s ∼94%

Asus Zenbook S 13 OLED
Samsung PM9A1 MZVL21T0HCLR


3188 (3158.91min – 3187.67max) MB/s ∼90% -4%

Lenovo Yoga Slim 7 Carbon 13IAP7-82U9005FGE
Samsung PM9A1 MZVL21T0HCLR


2967 (2915.46min – 2967.47max) MB/s ∼84% -11%

Average of class Subnotebook
  (153.3 – 4326, n=78, last 2 years)


2192 MB/s ∼62% -34%

Samsung Galaxy Book2 Pro 13 NP930XED-KA1DE
Samsung PM991a MZVLQ256HBJD


1129 (1111.78min – 1128.74max) MB/s ∼32% -66%

seq q8 t1 read
Asus ZenBook S13 OLED UX5304
Samsung PM9A1 MZVL21T0HCLR


7036 (6223.64min – 7035.55max) MB/s ∼100%

Dell XPS 13 Plus 9320 i7-1280P OLED
WDC PC SN810 512GB


6656 (5809.03min – 6655.73max) MB/s ∼95% -5%

Asus Zenbook S 13 OLED
Samsung PM9A1 MZVL21T0HCLR


6654 (5007.16min – 6653.54max) MB/s ∼95% -5%

Lenovo Yoga Slim 7 Carbon 13IAP7-82U9005FGE
Samsung PM9A1 MZVL21T0HCLR


6586 (5687.48min – 6585.52max) MB/s ∼94% -6%

Average Samsung PM9A1 MZVL21T0HCLR
  (3421 – 7061, n=55)


6394 MB/s ∼91% -9%

Average of class Subnotebook
  (469 – 7036, n=76, last 2 years)


3857 MB/s ∼55% -45%

Samsung Galaxy Book2 Pro 13 NP930XED-KA1DE
Samsung PM991a MZVLQ256HBJD


1584 (1489.82min – 1584.17max) MB/s ∼23% -77%

seq q8 t1 write
Asus ZenBook S13 OLED UX5304
Samsung PM9A1 MZVL21T0HCLR


5179 (4831.64min – 5178.79max) MB/s ∼100%

Asus Zenbook S 13 OLED
Samsung PM9A1 MZVL21T0HCLR


4938 (4919.31min – 4937.74max) MB/s ∼95% -5%

Lenovo Yoga Slim 7 Carbon 13IAP7-82U9005FGE
Samsung PM9A1 MZVL21T0HCLR


4921 (4913.24min – 4920.55max) MB/s ∼95% -5%

Average Samsung PM9A1 MZVL21T0HCLR
  (2226 – 5259, n=55)


4816 MB/s ∼93% -7%

Dell XPS 13 Plus 9320 i7-1280P OLED
WDC PC SN810 512GB


4468 (4431.23min – 4467.85max) MB/s ∼86% -14%

Average of class Subnotebook
  (60 – 5179, n=77, last 2 years)


2786 MB/s ∼54% -46%

Samsung Galaxy Book2 Pro 13 NP930XED-KA1DE
Samsung PM991a MZVLQ256HBJD


1014 (987.34min – 1013.83max) MB/s ∼20% -80%

4k q1 t1 read
Asus ZenBook S13 OLED UX5304
Samsung PM9A1 MZVL21T0HCLR


83.3 (77.84min – 83.26max) MB/s ∼100%

Average Samsung PM9A1 MZVL21T0HCLR
  (48.7 – 97.4, n=55)


76.7 MB/s ∼92% -8%

Lenovo Yoga Slim 7 Carbon 13IAP7-82U9005FGE
Samsung PM9A1 MZVL21T0HCLR


70.7 (69.77min – 70.71max) MB/s ∼85% -15%

Dell XPS 13 Plus 9320 i7-1280P OLED
WDC PC SN810 512GB


67.5 (65.71min – 67.48max) MB/s ∼81% -19%

Asus Zenbook S 13 OLED
Samsung PM9A1 MZVL21T0HCLR


67.3 (66.05min – 67.28max) MB/s ∼81% -19%

Average of class Subnotebook
  (12.6 – 141.9, n=77, last 2 years)


58.9 MB/s ∼71% -29%

Samsung Galaxy Book2 Pro 13 NP930XED-KA1DE
Samsung PM991a MZVLQ256HBJD


44.2 (42.17min – 44.2max) MB/s ∼53% -47%

4k q1 t1 write
Average Samsung PM9A1 MZVL21T0HCLR
  (49.9 – 275, n=55)


185.4 MB/s ∼100% +32%

Dell XPS 13 Plus 9320 i7-1280P OLED
WDC PC SN810 512GB


170.9 (165.47min – 170.92max) MB/s ∼92% +21%

Average of class Subnotebook
  (41.1 – 333, n=77, last 2 years)


154.4 MB/s ∼83% +10%

Asus Zenbook S 13 OLED
Samsung PM9A1 MZVL21T0HCLR


149.4 (148.22min – 149.37max) MB/s ∼81% +6%

Lenovo Yoga Slim 7 Carbon 13IAP7-82U9005FGE
Samsung PM9A1 MZVL21T0HCLR


143 (141.95min – 142.99max) MB/s ∼77% +2%

Asus ZenBook S13 OLED UX5304
Samsung PM9A1 MZVL21T0HCLR


140.8 (131.23min – 140.77max) MB/s ∼76%

Samsung Galaxy Book2 Pro 13 NP930XED-KA1DE
Samsung PM991a MZVLQ256HBJD


92 (90.59min – 91.98max) MB/s ∼50% -35%

4k q32 t16 read
Average Samsung PM9A1 MZVL21T0HCLR
  (376 – 4185, n=55)


2446 MB/s ∼100% +395%

Asus Zenbook S 13 OLED
Samsung PM9A1 MZVL21T0HCLR


1227 (1201.13min – 1227.26max) MB/s ∼50% +148%

Average of class Subnotebook
  (162 – 3484, n=77, last 2 years)


1158 MB/s ∼47% +134%

Samsung Galaxy Book2 Pro 13 NP930XED-KA1DE
Samsung PM991a MZVLQ256HBJD


814 (810.85min – 814.24max) MB/s ∼33% +65%

Lenovo Yoga Slim 7 Carbon 13IAP7-82U9005FGE
Samsung PM9A1 MZVL21T0HCLR


729 (720.43min – 729.23max) MB/s ∼30% +48%

Dell XPS 13 Plus 9320 i7-1280P OLED
WDC PC SN810 512GB


540 (532.43min – 540.23max) MB/s ∼22% +9%

Asus ZenBook S13 OLED UX5304
Samsung PM9A1 MZVL21T0HCLR


494 (392.19min – 494.04max) MB/s ∼20%

4k q32 t16 write
Average Samsung PM9A1 MZVL21T0HCLR
  (291 – 3559, n=55)


1804 MB/s ∼100% +385%

Average of class Subnotebook
  (130 – 2554, n=77, last 2 years)


785 MB/s ∼44% +111%

Samsung Galaxy Book2 Pro 13 NP930XED-KA1DE
Samsung PM991a MZVLQ256HBJD


749 (730.95min – 749.24max) MB/s ∼42% +101%

Asus Zenbook S 13 OLED
Samsung PM9A1 MZVL21T0HCLR


506 (496.78min – 506.11max) MB/s ∼28% +36%

Dell XPS 13 Plus 9320 i7-1280P OLED
WDC PC SN810 512GB


416 (398.57min – 416.29max) MB/s ∼23% +12%

Asus ZenBook S13 OLED UX5304
Samsung PM9A1 MZVL21T0HCLR


372 (323.75min – 372.35max) MB/s ∼21%

Lenovo Yoga Slim 7 Carbon 13IAP7-82U9005FGE
Samsung PM9A1 MZVL21T0HCLR


304 (294.31min – 304.17max) MB/s ∼17% -18%

AS SSD
Score Total
Average Samsung PM9A1 MZVL21T0HCLR
  (2577 – 9147, n=56)


6685 Points ∼100% +65%

Asus Zenbook S 13 OLED
Samsung PM9A1 MZVL21T0HCLR


5566 Points ∼83% +38%

Dell XPS 13 Plus 9320 i7-1280P OLED
WDC PC SN810 512GB


5114 Points ∼76% +26%

Lenovo Yoga Slim 7 Carbon 13IAP7-82U9005FGE
Samsung PM9A1 MZVL21T0HCLR


4572 Points ∼68% +13%

Asus ZenBook S13 OLED UX5304
Samsung PM9A1 MZVL21T0HCLR


4048 Points ∼61%

Average of class Subnotebook
  (545 – 8363, n=75, last 2 years)


3853 Points ∼58% -5%

Samsung Galaxy Book2 Pro 13 NP930XED-KA1DE
Samsung PM991a MZVLQ256HBJD


2470 Points ∼37% -39%

Score Read
Average Samsung PM9A1 MZVL21T0HCLR
  (983 – 3469, n=56)


2361 Points ∼100% +127%

Asus Zenbook S 13 OLED
Samsung PM9A1 MZVL21T0HCLR


1705 Points ∼72% +64%

Dell XPS 13 Plus 9320 i7-1280P OLED
WDC PC SN810 512GB


1451 Points ∼61% +40%

Average of class Subnotebook
  (199 – 3512, n=75, last 2 years)


1447 Points ∼61% +39%

Lenovo Yoga Slim 7 Carbon 13IAP7-82U9005FGE
Samsung PM9A1 MZVL21T0HCLR


1285 Points ∼54% +24%

Asus ZenBook S13 OLED UX5304
Samsung PM9A1 MZVL21T0HCLR


1040 Points ∼44%

Samsung Galaxy Book2 Pro 13 NP930XED-KA1DE
Samsung PM991a MZVLQ256HBJD


1039 Points ∼44% 0%

Score Write
Average Samsung PM9A1 MZVL21T0HCLR
  (921 – 4043, n=56)


3187 Points ∼100% +24%

Asus Zenbook S 13 OLED
Samsung PM9A1 MZVL21T0HCLR


3101 Points ∼97% +21%

Dell XPS 13 Plus 9320 i7-1280P OLED
WDC PC SN810 512GB


3046 Points ∼96% +19%

Lenovo Yoga Slim 7 Carbon 13IAP7-82U9005FGE
Samsung PM9A1 MZVL21T0HCLR


2728 Points ∼86% +6%

Asus ZenBook S13 OLED UX5304
Samsung PM9A1 MZVL21T0HCLR


2568 Points ∼81%

Average of class Subnotebook
  (251 – 3765, n=75, last 2 years)


1713 Points ∼54% -33%

Samsung Galaxy Book2 Pro 13 NP930XED-KA1DE
Samsung PM991a MZVLQ256HBJD


952 Points ∼30% -63%

Seq Read
Dell XPS 13 Plus 9320 i7-1280P OLED
WDC PC SN810 512GB


5411.56 MB/s ∼100% +6%

Asus ZenBook S13 OLED UX5304
Samsung PM9A1 MZVL21T0HCLR


5107 MB/s ∼94%

Average Samsung PM9A1 MZVL21T0HCLR
  (2638 – 5588, n=56)


4784 MB/s ∼88% -6%

Asus Zenbook S 13 OLED
Samsung PM9A1 MZVL21T0HCLR


4664 MB/s ∼86% -9%

Lenovo Yoga Slim 7 Carbon 13IAP7-82U9005FGE
Samsung PM9A1 MZVL21T0HCLR


4586 MB/s ∼85% -10%

Average of class Subnotebook
  (447 – 5546, n=75, last 2 years)


3003 MB/s ∼55% -41%

Samsung Galaxy Book2 Pro 13 NP930XED-KA1DE
Samsung PM991a MZVLQ256HBJD


2304 MB/s ∼43% -55%

Seq Write
Average Samsung PM9A1 MZVL21T0HCLR
  (1617 – 4477, n=56)


3180 MB/s ∼100% +12%

Asus ZenBook S13 OLED UX5304
Samsung PM9A1 MZVL21T0HCLR


2849 MB/s ∼90%

Dell XPS 13 Plus 9320 i7-1280P OLED
WDC PC SN810 512GB


2530.01 MB/s ∼80% -11%

Lenovo Yoga Slim 7 Carbon 13IAP7-82U9005FGE
Samsung PM9A1 MZVL21T0HCLR


2264 MB/s ∼71% -21%

Asus Zenbook S 13 OLED
Samsung PM9A1 MZVL21T0HCLR


2179 MB/s ∼69% -24%

Average of class Subnotebook
  (277 – 3955, n=75, last 2 years)


1823 MB/s ∼57% -36%

Samsung Galaxy Book2 Pro 13 NP930XED-KA1DE
Samsung PM991a MZVLQ256HBJD


1042 MB/s ∼33% -63%

4K Read
Average Samsung PM9A1 MZVL21T0HCLR
  (45.9 – 88.1, n=56)


72.4 MB/s ∼100% +13%

Dell XPS 13 Plus 9320 i7-1280P OLED
WDC PC SN810 512GB


70.31 MB/s ∼97% +10%

Lenovo Yoga Slim 7 Carbon 13IAP7-82U9005FGE
Samsung PM9A1 MZVL21T0HCLR


65.31 MB/s ∼90% +2%

Asus ZenBook S13 OLED UX5304
Samsung PM9A1 MZVL21T0HCLR


64.1 MB/s ∼89%

Asus Zenbook S 13 OLED
Samsung PM9A1 MZVL21T0HCLR


63.64 MB/s ∼88% -1%

Average of class Subnotebook
  (8.95 – 84.8, n=75, last 2 years)


56.6 MB/s ∼78% -12%

Samsung Galaxy Book2 Pro 13 NP930XED-KA1DE
Samsung PM991a MZVLQ256HBJD


45.6 MB/s ∼63% -29%

4K Write
Dell XPS 13 Plus 9320 i7-1280P OLED
WDC PC SN810 512GB


232.86 MB/s ∼100% +17%

Asus ZenBook S13 OLED UX5304
Samsung PM9A1 MZVL21T0HCLR


198.7 MB/s ∼85%

Average Samsung PM9A1 MZVL21T0HCLR
  (118.6 – 241, n=56)


185.5 MB/s ∼80% -7%

Average of class Subnotebook
  (48 – 294, n=75, last 2 years)


158.3 MB/s ∼68% -20%

Lenovo Yoga Slim 7 Carbon 13IAP7-82U9005FGE
Samsung PM9A1 MZVL21T0HCLR


154.32 MB/s ∼66% -22%

Samsung Galaxy Book2 Pro 13 NP930XED-KA1DE
Samsung PM991a MZVLQ256HBJD


152.4 MB/s ∼65% -23%

Asus Zenbook S 13 OLED
Samsung PM9A1 MZVL21T0HCLR


151.15 MB/s ∼65% -24%

4K-64 Read
Average Samsung PM9A1 MZVL21T0HCLR
  (421 – 2854, n=56)


1810 MB/s ∼100% +288%

Asus Zenbook S 13 OLED
Samsung PM9A1 MZVL21T0HCLR


1174.58 MB/s ∼65% +152%

Average of class Subnotebook
  (145 – 2938, n=75, last 2 years)


1090 MB/s ∼60% +134%

Dell XPS 13 Plus 9320 i7-1280P OLED
WDC PC SN810 512GB


839.87 MB/s ∼46% +80%

Samsung Galaxy Book2 Pro 13 NP930XED-KA1DE
Samsung PM991a MZVLQ256HBJD


763.3 MB/s ∼42% +64%

Lenovo Yoga Slim 7 Carbon 13IAP7-82U9005FGE
Samsung PM9A1 MZVL21T0HCLR


760.99 MB/s ∼42% +63%

Asus ZenBook S13 OLED UX5304
Samsung PM9A1 MZVL21T0HCLR


466 MB/s ∼26%

4K-64 Write
Asus Zenbook S 13 OLED
Samsung PM9A1 MZVL21T0HCLR


2732.34 MB/s ∼100% +31%

Average Samsung PM9A1 MZVL21T0HCLR
  (367 – 3451, n=56)


2684 MB/s ∼98% +29%

Dell XPS 13 Plus 9320 i7-1280P OLED
WDC PC SN810 512GB


2560.31 MB/s ∼94% +23%

Lenovo Yoga Slim 7 Carbon 13IAP7-82U9005FGE
Samsung PM9A1 MZVL21T0HCLR


2347.47 MB/s ∼86% +13%

Asus ZenBook S13 OLED UX5304
Samsung PM9A1 MZVL21T0HCLR


2084 MB/s ∼76%

Average of class Subnotebook
  (157.4 – 3196, n=75, last 2 years)


1372 MB/s ∼50% -34%

Samsung Galaxy Book2 Pro 13 NP930XED-KA1DE
Samsung PM991a MZVLQ256HBJD


695.1 MB/s ∼25% -67%

Access Time Read
Samsung Galaxy Book2 Pro 13 NP930XED-KA1DE
Samsung PM991a MZVLQ256HBJD


0.18 ms * ∼100% -620%

Dell XPS 13 Plus 9320 i7-1280P OLED
WDC PC SN810 512GB


0.082 ms * ∼46% -228%

Average of class Subnotebook
  (0.021 – 0.5, n=74, last 2 years)


0.07018 ms * ∼39% -181%

Average Samsung PM9A1 MZVL21T0HCLR
  (0.02 – 0.083, n=56)


0.03705 ms * ∼21% -48%

Lenovo Yoga Slim 7 Carbon 13IAP7-82U9005FGE
Samsung PM9A1 MZVL21T0HCLR


0.031 ms * ∼17% -24%

Asus ZenBook S13 OLED UX5304
Samsung PM9A1 MZVL21T0HCLR


0.025 ms * ∼14%

Asus Zenbook S 13 OLED
Samsung PM9A1 MZVL21T0HCLR


0.023 ms * ∼13% +8%

Access Time Write
Average of class Subnotebook
  (0.013 – 0.703, n=75, last 2 years)


0.06723 ms * ∼100% -169%

Dell XPS 13 Plus 9320 i7-1280P OLED
WDC PC SN810 512GB


0.049 ms * ∼73% -96%

Average Samsung PM9A1 MZVL21T0HCLR
  (0.018 – 0.101, n=56)


0.03364 ms * ∼50% -35%

Asus Zenbook S 13 OLED
Samsung PM9A1 MZVL21T0HCLR


0.027 ms * ∼40% -8%

Samsung Galaxy Book2 Pro 13 NP930XED-KA1DE
Samsung PM991a MZVLQ256HBJD


0.025 ms * ∼37% -0%

Asus ZenBook S13 OLED UX5304
Samsung PM9A1 MZVL21T0HCLR


0.025 ms * ∼37%

Lenovo Yoga Slim 7 Carbon 13IAP7-82U9005FGE
Samsung PM9A1 MZVL21T0HCLR


0.024 ms * ∼36% +4%

* … smaller is better

035571010651420177521302485284031953550390542604615497053255680603563906745Tooltip
GPU-Z Iris Xe Graphics G7

We have already known the integrated Iris Xe Graphics G7 graphics card from Intel for a while, and the Zenbook uses the faster version with 96 EUs and a maximum clock speed of 1,300 MHz. For everyday tasks including the reproduction of high-resolution videos, the iGPU is also sufficient, but the problem is revealed in the comparison with the Radeon 680M in the predecessor that runs on average 36% faster in our synthetic GPU tests.

In our gaming benchmarks, the difference in 1080p resolution and at high details is even more pronounced, and the old Radeon 680M is even a hefty 56% faster. This means that the gaming performance of the new Zenbook S 13 is significantly lower, and if you like gaming, you have to reduce the graphic details considerably. But at least, the graphics performance remains stable even during longer gaming sessions. However, the performance is 12% lower in battery operation. You can find additional GPU benchmarks here.

3DMark Performance Rating – Percent
Apple MacBook Air M2 10C GPU -3!
Apple M2 10-Core GPU, Apple M2


100 pt ∼100%

Asus Zenbook S 13 OLED
AMD Radeon 680M, AMD Ryzen 7 6800U


88.9 pt ∼89%

Dell XPS 13 Plus 9320 i7-1280P OLED -1!
Intel Iris Xe Graphics G7 96EUs, Intel Core i7-1280P


78.3 pt ∼78%

Lenovo Yoga Slim 7 Carbon 13IAP7-82U9005FGE
Intel Iris Xe Graphics G7 96EUs, Intel Core i7-1260P


70 pt ∼70%

Average of class Subnotebook


68.4 pt ∼68%

Asus ZenBook S13 OLED UX5304
Intel Iris Xe Graphics G7 96EUs, Intel Core i7-1355U


65.6 pt ∼66%

Average Intel Iris Xe Graphics G7 96EUs


64.2 pt ∼64%

Samsung Galaxy Book2 Pro 13 NP930XED-KA1DE -1!
Intel Iris Xe Graphics G7 80EUs, Intel Core i5-1240P


58.7 pt ∼59%

3DMark 11 – 1280×720 Performance GPU
Asus Zenbook S 13 OLED
AMD Radeon 680M, AMD Ryzen 7 6800U


9095 Points ∼100% +44%

Dell XPS 13 Plus 9320 i7-1280P OLED
Intel Iris Xe Graphics G7 96EUs, Intel Core i7-1280P


7016 Points ∼77% +11%

Lenovo Yoga Slim 7 Carbon 13IAP7-82U9005FGE
Intel Iris Xe Graphics G7 96EUs, Intel Core i7-1260P


6551 Points ∼72% +3%

Average of class Subnotebook
  (583 – 16904, n=72, last 2 years)


6545 Points ∼72% +3%

Asus ZenBook S13 OLED UX5304
Intel Iris Xe Graphics G7 96EUs, Intel Core i7-1355U


6334 Points ∼70%

Average Intel Iris Xe Graphics G7 96EUs
  (2867 – 7222, n=149)


6309 Points ∼69% 0%

Samsung Galaxy Book2 Pro 13 NP930XED-KA1DE
Intel Iris Xe Graphics G7 80EUs, Intel Core i5-1240P


4895 Points ∼54% -23%

3DMark
1920×1080 Fire Strike Graphics
Asus Zenbook S 13 OLED
AMD Radeon 680M, AMD Ryzen 7 6800U


6683 Points ∼100% +31%

Dell XPS 13 Plus 9320 i7-1280P OLED
Intel Iris Xe Graphics G7 96EUs, Intel Core i7-1280P


5393 Points ∼81% +6%

Lenovo Yoga Slim 7 Carbon 13IAP7-82U9005FGE
Intel Iris Xe Graphics G7 96EUs, Intel Core i7-1260P


5259 Points ∼79% +3%

Asus ZenBook S13 OLED UX5304
Intel Iris Xe Graphics G7 96EUs, Intel Core i7-1355U


5101 Points ∼76%

Average Intel Iris Xe Graphics G7 96EUs
  (2286 – 5955, n=160)


4823 Points ∼72% -5%

Average of class Subnotebook
  (436 – 12349, n=76, last 2 years)


4734 Points ∼71% -7%

Samsung Galaxy Book2 Pro 13 NP930XED-KA1DE
Intel Iris Xe Graphics G7 80EUs, Intel Core i5-1240P


4408 Points ∼66% -14%

2560×1440 Time Spy Graphics
Asus Zenbook S 13 OLED
AMD Radeon 680M, AMD Ryzen 7 6800U


2287 Points ∼100% +52%

Dell XPS 13 Plus 9320 i7-1280P OLED
Intel Iris Xe Graphics G7 96EUs, Intel Core i7-1280P


1760 Points ∼77% +17%

Lenovo Yoga Slim 7 Carbon 13IAP7-82U9005FGE
Intel Iris Xe Graphics G7 96EUs, Intel Core i7-1260P


1683 Points ∼74% +12%

Average of class Subnotebook
  (517 – 4773, n=73, last 2 years)


1545 Points ∼68% +3%

Asus ZenBook S13 OLED UX5304
Intel Iris Xe Graphics G7 96EUs, Intel Core i7-1355U


1505 Points ∼66%

Average Intel Iris Xe Graphics G7 96EUs
  (707 – 1871, n=158)


1474 Points ∼64% -2%

Samsung Galaxy Book2 Pro 13 NP930XED-KA1DE
Intel Iris Xe Graphics G7 80EUs, Intel Core i5-1240P


1285 Points ∼56% -15%

Wild Life Extreme Unlimited
Apple MacBook Air M2 10C GPU
Apple M2 10-Core GPU, Apple M2


6824 Points ∼100% +98%

Average of class Subnotebook
  (2000 – 9340, n=16, last 2 years)


4319 Points ∼63% +25%

Lenovo Yoga Slim 7 Carbon 13IAP7-82U9005FGE
Intel Iris Xe Graphics G7 96EUs, Intel Core i7-1260P


3796 Points ∼56% +10%

Asus Zenbook S 13 OLED
AMD Radeon 680M, AMD Ryzen 7 6800U


3793 Points ∼56% +10%

Average Intel Iris Xe Graphics G7 96EUs
  (2054 – 4221, n=18)


3473 Points ∼51% +1%

Asus ZenBook S13 OLED UX5304
Intel Iris Xe Graphics G7 96EUs, Intel Core i7-1355U


3443 Points ∼50%

3DMark 06 Standard Score25303 points
3DMark 11 Performance6644 points
3DMark Fire Strike Score4613 points
3DMark Time Spy Score1683 points

Help

Performance Rating – Percent
Asus Zenbook S 13 OLED
AMD Ryzen 7 6800U, AMD Radeon 680M


96.7 pt ∼97%

Dell XPS 13 Plus 9320 i7-1280P OLED
Intel Core i7-1280P, Intel Iris Xe Graphics G7 96EUs


77.6 pt ∼78%

Average of class Subnotebook


75.9 pt ∼76%

Lenovo Yoga Slim 7 Carbon 13IAP7-82U9005FGE
Intel Core i7-1260P, Intel Iris Xe Graphics G7 96EUs


73.8 pt ∼74%

Asus ZenBook S13 OLED UX5304
Intel Core i7-1355U, Intel Iris Xe Graphics G7 96EUs


62.1 pt ∼62%

Samsung Galaxy Book2 Pro 13 NP930XED-KA1DE -2!
Intel Core i5-1240P, Intel Iris Xe Graphics G7 80EUs


49 pt ∼49%

The Witcher 3 – 1920×1080 Ultra Graphics & Postprocessing (HBAO+)
Asus Zenbook S 13 OLED
AMD Ryzen 7 6800U, AMD Radeon 680M


23 (19min, 22P1) fps ∼100% +87%

Dell XPS 13 Plus 9320 i7-1280P OLED
Intel Core i7-1280P, Intel Iris Xe Graphics G7 96EUs


16.4 (14min) fps ∼71% +33%

Average of class Subnotebook
  (5.6 – 44.2, n=66, last 2 years)


15.5 fps ∼67% +26%

Lenovo Yoga Slim 7 Carbon 13IAP7-82U9005FGE
Intel Core i7-1260P, Intel Iris Xe Graphics G7 96EUs


13.5 (12min, 12P1) fps ∼59% +10%

Asus ZenBook S13 OLED UX5304
Intel Core i7-1355U, Intel Iris Xe Graphics G7 96EUs


12.3 (11min, 11P1) fps ∼53%

Samsung Galaxy Book2 Pro 13 NP930XED-KA1DE
Intel Core i5-1240P, Intel Iris Xe Graphics G7 80EUs


11 fps ∼48% -11%

GTA V – 1920×1080 Highest Settings possible AA:4xMSAA + FX AF:16x
Asus Zenbook S 13 OLED
AMD Ryzen 7 6800U, AMD Radeon 680M


21.3 (3.35min, 14.5P1) fps ∼100% +126%

Average of class Subnotebook
  (5.01 – 67.5, n=46, last 2 years)


15.5 fps ∼73% +65%

Dell XPS 13 Plus 9320 i7-1280P OLED
Intel Core i7-1280P, Intel Iris Xe Graphics G7 96EUs


11.5 (4.27min, 7.69P1) fps ∼54% +22%

Asus ZenBook S13 OLED UX5304
Intel Core i7-1355U, Intel Iris Xe Graphics G7 96EUs


9.42 (3.26min, 5.92P1) fps ∼44%

Lenovo Yoga Slim 7 Carbon 13IAP7-82U9005FGE
Intel Core i7-1260P, Intel Iris Xe Graphics G7 96EUs


9.34 (1.186min, 1.515P1) fps ∼44% -1%

Samsung Galaxy Book2 Pro 13 NP930XED-KA1DE
Intel Core i5-1240P, Intel Iris Xe Graphics G7 80EUs


6.2 (0.771min, 3.61P1) fps ∼29% -34%

Final Fantasy XV Benchmark – 1920×1080 High Quality
Lenovo Yoga Slim 7 Carbon 13IAP7-82U9005FGE
Intel Core i7-1260P, Intel Iris Xe Graphics G7 96EUs


24.1 fps ∼100% +62%

Asus Zenbook S 13 OLED
AMD Ryzen 7 6800U, AMD Radeon 680M


21.9 fps ∼91% +47%

Dell XPS 13 Plus 9320 i7-1280P OLED
Intel Core i7-1280P, Intel Iris Xe Graphics G7 96EUs


17.6 fps ∼73% +18%

Average of class Subnotebook
  (5.24 – 50.1, n=56, last 2 years)


17.5 fps ∼73% +17%

Asus ZenBook S13 OLED UX5304
Intel Core i7-1355U, Intel Iris Xe Graphics G7 96EUs


14.9 fps ∼62%

Strange Brigade – 1920×1080 ultra AA:ultra AF:16
Asus Zenbook S 13 OLED
AMD Ryzen 7 6800U, AMD Radeon 680M


40.2 (17.3min, 27.4P1) fps ∼100% +70%

Dell XPS 13 Plus 9320 i7-1280P OLED
Intel Core i7-1280P, Intel Iris Xe Graphics G7 96EUs


29.6 (9min, 10.7P1) fps ∼74% +25%

Average of class Subnotebook
  (15.7 – 86, n=52, last 2 years)


28.5 fps ∼71% +21%

Asus ZenBook S13 OLED UX5304
Intel Core i7-1355U, Intel Iris Xe Graphics G7 96EUs


23.6 (5min, 6.37P1) fps ∼59%

Lenovo Yoga Slim 7 Carbon 13IAP7-82U9005FGE
Intel Core i7-1260P, Intel Iris Xe Graphics G7 96EUs


22.3 (6.7min, 7.93P1) fps ∼55% -6%

Dota 2 Reborn – 1920×1080 ultra (3/3) best looking
Asus Zenbook S 13 OLED
AMD Ryzen 7 6800U, AMD Radeon 680M


62.7 (53.2min) fps ∼100% +23%

Dell XPS 13 Plus 9320 i7-1280P OLED
Intel Core i7-1280P, Intel Iris Xe Graphics G7 96EUs


58.7 (50.7min) fps ∼94% +15%

Lenovo Yoga Slim 7 Carbon 13IAP7-82U9005FGE
Intel Core i7-1260P, Intel Iris Xe Graphics G7 96EUs


56 (48.5min) fps ∼89% +10%

Average of class Subnotebook
  (7.2 – 113, n=75, last 2 years)


52.6 fps ∼84% +3%

Asus ZenBook S13 OLED UX5304
Intel Core i7-1355U, Intel Iris Xe Graphics G7 96EUs


51.1 (42.7min) fps ∼81%

Samsung Galaxy Book2 Pro 13 NP930XED-KA1DE
Intel Core i5-1240P, Intel Iris Xe Graphics G7 80EUs


39.4 (32.6min) fps ∼63% -23%

X-Plane 11.11 – 1920×1080 high (fps_test=3)
Dell XPS 13 Plus 9320 i7-1280P OLED
Intel Core i7-1280P, Intel Iris Xe Graphics G7 96EUs


37.6 fps ∼100% +38%

Lenovo Yoga Slim 7 Carbon 13IAP7-82U9005FGE
Intel Core i7-1260P, Intel Iris Xe Graphics G7 96EUs


35.9 fps ∼95% +32%

Asus Zenbook S 13 OLED
AMD Ryzen 7 6800U, AMD Radeon 680M


33.6 fps ∼89% +23%

Average of class Subnotebook
  (3.79 – 82.3, n=73, last 2 years)


33.1 fps ∼88% +21%

Asus ZenBook S13 OLED UX5304
Intel Core i7-1355U, Intel Iris Xe Graphics G7 96EUs


27.3 fps ∼73%

Samsung Galaxy Book2 Pro 13 NP930XED-KA1DE
Intel Core i5-1240P, Intel Iris Xe Graphics G7 80EUs


21.2 fps ∼56% -22%

01234567891011121314Tooltip

The two small fans clearly represent the largest problem of the Zenbook S 13. While the noise level remains basically within limits – as long as you disregard the Performance mode that produces a maximum of 47.8 dB(A) – the problem is a very high-frequency noise. Looking at the chart below, you might think that the Whisper mode might be the best choice, but you can already hear the high-frequency noise clearly even at a low fan speed and it becomes very annoying. In Standard mode, some of it is at least covered by the whirring noise. In addition, the fans also rev up quickly, for example when playing a YouTube video, which makes things even worse. This problem would definitely represent a disqualifying point for us.

Whisper modeStandard modePerformance mode
3DMark 0626 dB(A)37.7 dB(A)47.8 dB(A)
Witcher 326 dB(A)40.1 dB(A)47.8 dB(A)
Stress test26 dB(A)40.1 dB(A)47.8 dB(A)

Noise Level

Idle

23.3 / 23.3 / 23.3 dB(A)

Load 37.7 / 40.1 dB(A)
  red to green bar
 

30 dB
silent

40 dB(A)
audible

50 dB(A)
loud


min: dark, med: mid, max: light   Earthworks M23R, Arta (15 cm distance)   environment noise: 23.3 dB(A)

dB(A) 0102030405060708090Deep BassMiddle BassHigh BassLower RangeMidsHigher MidsLower HighsMid HighsUpper HighsSuper Highs2025.126.222.424.822.82524.926.221.327.922.13124.322.122.324.4234026.424.72325.924.55022.123.120.524.222.66322.822.921.923.620.88021.318.91920.419.210021.633.630.820.220.512524.940.222.816.818.416021.116.614.416.414.620020.117.216.515.515.525019.22018.417.718.93151518.118.213.413.440015.820.620.4111150018.520.820.510.810.763018.72424.113.213.780013.126.324.59.610.3100012.22825.99.710.7125012.830.2279.211160011.829.727.59.811200012.727.826.99.911.1250017.729.526.810.211.5315012.728.225.710.711.6400014.729.225.611.111.9500014.128.326.211.512.2630011.926.824.511.612.180001228.826.211.912.7100001221.717.712.112.31250012.517.81513.711.71600012.113.912.811.211.3SPL26.640.137.723.324N0.83.52.70.50.5median 14.1median 26.8median 24.5median 11.5median 11.9Delta3.34.53.81.71.7hearing rangehide median Fan Noise
Asus ZenBook S13 OLED UX5304
Iris Xe G7 96EUs, i7-1355U, Samsung PM9A1 MZVL21T0HCLR
Asus Zenbook S 13 OLED
Radeon 680M, R7 6800U, Samsung PM9A1 MZVL21T0HCLR
Lenovo Yoga Slim 7 Carbon 13IAP7-82U9005FGE
Iris Xe G7 96EUs, i7-1260P, Samsung PM9A1 MZVL21T0HCLR
Dell XPS 13 Plus 9320 i7-1280P OLED
Iris Xe G7 96EUs, i7-1280P, WDC PC SN810 512GB
Samsung Galaxy Book2 Pro 13 NP930XED-KA1DE
Iris Xe G7 80EUs, i5-1240P, Samsung PM991a MZVLQ256HBJD
Noise

-1%

-6%

0%

-5%

off / environment *

23.3

24

-3%

24.2

-4%

23.4

-0%

24.6

-6%

Idle Minimum *

23.3

24

-3%

24.2

-4%

23.4

-0%

24.6

-6%

Idle Average *

23.3

24

-3%

24.2

-4%

23.4

-0%

24.6

-6%

Idle Maximum *

23.3

24

-3%

25.1

-8%

23.4

-0%

26.3

-13%

Load Average *

37.7

33.1

12%

41.9

-11%

35

7%

38.4

-2%

Witcher 3 ultra *

40.1

40.2

-0%

41.9

-4%

41.6

-4%

Load Maximum *

40.1

41.7

-4%

41.9

-4%

39.9

-0%

38.7

3%

* … smaller is better

In everyday operation, the Zenbook remains very cool. Under load, particularly the central area on top of the base unit warms up. However, you can still keep the device on your lap without any problems, since the base unit is raised slightly. The warmth also becomes noticeable while typing, but it doesn’t create any limitations.

During the stress test, we briefly see a consumption of more than 40 watts, but already after a few seconds, the value levels out at slightly less than 17 watts, remaining at that level afterwards.

CPU/iGPU measurements during the stress test
 39.8 °C
104 F
43.1 °C
110 F
40.9 °C
106 F
 
 37.4 °C
99 F
42.3 °C
108 F
37.1 °C
99 F
 
 26.1 °C
79 F
25.7 °C
78 F
25.8 °C
78 F
 
Maximum: 43.1 °C = 110 F
Average: 35.4 °C = 96 F
42.2 °C
108 F
45 °C
113 F
40.4 °C
105 F
37.2 °C
99 F
40.4 °C
105 F
35.2 °C
95 F
28.5 °C
83 F
29.4 °C
85 F
28.1 °C
83 F
Maximum: 45 °C = 113 F
Average: 36.3 °C = 97 F

Power Supply (max.)  38.2 °C = 101 F | Room Temperature 19.7 °C = 67 F | Fluke t3000FC (calibrated), Voltcraft IR-900

(±) The average temperature for the upper side under maximal load is 35.4 °C / 96 F, compared to the average of 30.7 °C / 87 F for the devices in the class Subnotebook.
(±) The maximum temperature on the upper side is 43.1 °C / 110 F, compared to the average of 35.8 °C / 96 F, ranging from 21.4 to 59 °C for the class Subnotebook.
(±) The bottom heats up to a maximum of 45 °C / 113 F, compared to the average of 39.5 °C / 103 F
(+) In idle usage, the average temperature for the upper side is 24.6 °C / 76 F, compared to the device average of 30.7 °C / 87 F.
(±) Playing The Witcher 3, the average temperature for the upper side is 34.8 °C / 95 F, compared to the device average of 30.7 °C / 87 F.
(+) The palmrests and touchpad are cooler than skin temperature with a maximum of 26.1 °C / 79 F and are therefore cool to the touch.
(+) The average temperature of the palmrest area of similar devices was 28.3 °C / 82.9 F (+2.2 °C / 3.9 F).

The two built-in speakers offer a good performance and can even become very loud due to the software amplification. But there is a clearly audible difference to the current Apple MacBook Air M2 overall. However, the quality is still completely sufficient for background music or videos. 

dB(A) 0102030405060708090Deep BassMiddle BassHigh BassLower RangeMidsHigher MidsLower HighsMid HighsUpper HighsSuper Highs2024.8292527.929.13124.4294025.930.25024.231.16323.631.18020.437.210020.248.812516.853.116016.452.420015.554.325017.75531513.458.44001163.250010.866.463013.265.38009.669.310009.772.112509.271.316009.872.420009.971.7250010.272.9315010.773.9400011.170.9500011.571.2630011.668.1800011.970.71000012.168.11250013.763.41600011.249SPL23.383N0.556.9median 11.5median 68.1Delta1.77.327.828.528.427.522.324.327.93122.128.821.524.718.132.716.950.718.556.91851.916.456.915.56014.365.312.968.612.270.911.969.211.567.111.868.211.167.911.369.311.57111.671.612.172.412.671.912.471.612.972.113.169.412.771.712.872.113.660.824.482.70.658.3median 12.7median 69.21.35.6hearing rangehide median Pink Noise

During idle operation, the new model is slightly more efficient than its AMD predecessor. We measured both models with the same wallpaper and dark Windows mode. With bright image contents, the power consumption of the OLED panel increases. This is also the case when playing HDR videos, where peak values can reach more than 20 watts at full brightness. 

During the stress test, we measure a maximum of almost 60 watts in the beginning, but already after a few seconds, the consumption levels out around 30 watts. The included 65-Watt charger is completely sufficient.

Asus ZenBook S13 OLED UX5304
i7-1355U, Iris Xe G7 96EUs, Samsung PM9A1 MZVL21T0HCLR, OLED, 2880×1800, 13.30
Asus Zenbook S 13 OLED
R7 6800U, Radeon 680M, Samsung PM9A1 MZVL21T0HCLR, OLED, 2880×1800, 13.30
Apple MacBook Air M2 10C GPU
M2, M2 10-Core GPU, Apple SSD AP1024Z, IPS, 2560×1664, 13.60
Lenovo Yoga Slim 7 Carbon 13IAP7-82U9005FGE
i7-1260P, Iris Xe G7 96EUs, Samsung PM9A1 MZVL21T0HCLR, IPS, 2560×1600, 13.30
Dell XPS 13 Plus 9320 i7-1280P OLED
i7-1280P, Iris Xe G7 96EUs, WDC PC SN810 512GB, OLED, 3456×2160, 13.40
Samsung Galaxy Book2 Pro 13 NP930XED-KA1DE
i5-1240P, Iris Xe G7 80EUs, Samsung PM991a MZVLQ256HBJD, OLED, 1920×1080, 13.30
Average Intel Iris Xe Graphics G7 96EUs
 
Average of class Subnotebook
 
Power Consumption

-11%

13%

-29%

-33%

5%

-10%

-5%

Idle Minimum *

5.8

4.8

17%

1.9

67%

6.9

-19%

6.5

-12%

4.3

26%

At 63 Wh, the battery capacity is slightly lower than that of the old model. In our video test at 150 cd/m² (corresponding to 74% of the maximum SDR brightness in our test unit), a battery life of almost 14 hours is still a very good result. The WLAN test runs for more than 11 hours at 150 cd/m², and still slightly more than 8 hours at full brightness. An HDR YouTube video runs for 4.5 hours at full brightness. Overall, these are very good results for the slim Zenbook.

Battery Runtime

WiFi Websurfing (Edge 112)11h 18min
WiFi Websurfing max. Brightness (Edge 112)8h 21min
Big Buck Bunny H.264 1080p13h 49min
Load (maximum brightness)2h 26min
Asus ZenBook S13 OLED UX5304
i7-1355U, Iris Xe G7 96EUs, 63 Wh
Asus Zenbook S 13 OLED
R7 6800U, Radeon 680M, 67 Wh
Apple MacBook Air M2 10C GPU
M2, M2 10-Core GPU, 52.6 Wh
Lenovo Yoga Slim 7 Carbon 13IAP7-82U9005FGE
i7-1260P, Iris Xe G7 96EUs, 50.2 Wh
Dell XPS 13 Plus 9320 i7-1280P OLED
i7-1280P, Iris Xe G7 96EUs, 55 Wh
Samsung Galaxy Book2 Pro 13 NP930XED-KA1DE
i5-1240P, Iris Xe G7 80EUs, 63 Wh
Average of class Subnotebook
 
Battery Runtime

-3%

22%

-38%

-49%

-4%

-21%

H.264

829

912

10%

946

14%

632

-24%

693

-16%

Testing the Asus Zenbook S 13. Test unit provided by Asus Germany.

The new Zenbook S 13 leaves us with mixed feelings, particularly since last year’s model was so good. Asus has completely reworked the device, making the laptop noticeably slimmer. The result also looks good and the case makes a great impression, particularly also in terms of the stability. The new plasma ceramic surface feels great, and there are no problems with fingerprints. In addition, it now includes some of the known connections such as an HDMI port and a regular USB-A connection, which is a good achievement in such a slim device. 

However, the keystroke had to be shortened by 0.3 mm (~0.012 in) for the slimming of the design. While the keyboard continues to be decent, the old Zenbook offered a more comfortable typing experience. In addition, the cooling is now weaker, and even if the new Intel Core i7-1355U Raptor Lake processor offers a slightly higher single-core performance, it was clearly surpassed by last year’s AMD Ryzen 7 6800U in the multicore scenarios and particularly in terms of the iGPU.

The OLED display continues to offer a great image quality, achieving a very accurate color reproduction already in the state of delivery. In addition, Asus is currently the only manufacturer who offers a software solution to prevent the harmful PWM flickering, enabling DC dimming even at low brightness settings.

The new Asus Zenbook S 13 has become significantly slimmer, but the new Intel processor also offers a lower performance overall than its AMD predecessor. But the largest problem is the high-frequency fan noise even at low fan speeds.

The largest problem of the new Zenbook is represented by the fans that produce a very high-frequency noise even at low speed levels. This is simply annoying, even during everyday tasks. We therefore also lowered the evaluation in this category. Although the performance is good in many areas, we can hardly recommend the new model for this reason. Those who don’t mind a 3-mm (~0.12 in) thicker device should rather take a look at last year’s Zenbook S 13 or wait for the updated 2022 version with the new Ryzen Zen4 chip.

The new Zenbook S 13 OLED is currently available from Amazon for $1529, for example.

Asus ZenBook S13 OLED UX5304

04/29/2023 v7

Andreas Osthoff

Connectivity

66 / 75 → 89%

Games Performance

63 / 78 → 81%

Application Performance

89 / 85 → 100%

Subnotebook – Weighted Average

More articles related to this device

Asus ZenBook S13 OLED UX5304 (ZenBook S13 Series)

Related Articles

Transparency

The present review sample was made available to the author as a loan by the manufacturer or a shop for the purposes of review. The lender had no influence on this review, nor did the manufacturer receive a copy of this review before publication. There was no obligation to publish this review.

Pricecompare

Andreas Osthoff, 2023-05- 1 (Update: 2023-05- 1)

Read More
Andreas Osthoff

Latest

UK festival canceled after headliner Kanye West blocked from traveling to UK

Music Organizers of a popular London music festival say...

Burna Boy’s Music Banned Across Various Platforms after Fight with DJ Tunez

Music The Nigerian DJ Association (NDJ) has officially...

“I Use Juju To Succeed, It’s Not Good To Be Poor” – Saheed Osupa [Video]

Music “I Use Juju To Succeed, It’s Not Good...

Jeff Goldblum Answers the Proust Questionnaire

Music What is your idea of perfect happiness?Every single...

Newsletter

Don't miss

UK festival canceled after headliner Kanye West blocked from traveling to UK

Music Organizers of a popular London music festival say...

Burna Boy’s Music Banned Across Various Platforms after Fight with DJ Tunez

Music The Nigerian DJ Association (NDJ) has officially...

“I Use Juju To Succeed, It’s Not Good To Be Poor” – Saheed Osupa [Video]

Music “I Use Juju To Succeed, It’s Not Good...

Jeff Goldblum Answers the Proust Questionnaire

Music What is your idea of perfect happiness?Every single...

Events Happening In Lagos This April (April 9th-April 26th)

Music Lagos is filled with events this month targeting...

Getting a business loan now comes with a frequent flyer upside

Australian fintech Prospa has partnered with Qantas Business Rewards, letting eligible SMEs earn up to 500,000 points per loan. What’s happening: Australian fintech lender Prospa has partnered with Qantas Business Rewards to allow eligible small and medium business owners to earn up to 500,000 Qantas Points per loan when taking out a Prospa Small Business

Why I went into real estate business years ago – Pastor Matthew Ashimolowo explains

Pastor Matthew Ashimolowo is one of the respected men of God in Nigeria. He is a global player. The headquarters of his church. KICC is in the UK. And he has run the church for years. Many don’t know that he is also a big real estate player both in London & Nigeria. He is the

The Vogue Business Funding Tracker

Introducing the Vogue Business Funding Tracker, a running list highlighting the most notable and intriguing investment and M&A activity in fashion and beauty. From emerging disruptors to legacy giants undergoing major changes, we spotlight the deals that are shifting the dynamics of the sectors we cover, including fashion, beauty, tech and sustainability. April 2026 Icicle