MSI Katana 17 B13V laptop review: Nvidia GeForce RTX 4060 makes its debut Reviews

Ada Lovelace for everyone. The high-end models of Nvidia’s new laptop GPUs recently debuted and are now followed by the mid-range RTX 4060 – a card we were able to test in the MSI Katana 17 B13V.

5499 dollars. That is how much potential buyers have to shell out for the MSI Titan GT77. On the one hand, you get the ultimate in power but not many people will be willing to spend that much on a laptop. With a few cut corners, the MSI Katana 17 B13VFK shows that cheaper can work too: With a Raptor Lake CPU and Nvidia GeForce RTX 4060, this gaming laptop (currently unavailable on Amazon and Best Buy) can be had in Germany for around 1999 euros. Still a lot of money but around two-thirds cheaper. In our extensive review, we reveal whether or not performance also takes a similar hit. 

Processor

Intel Core i7-13620H 10 x 1.8 – 4.9 GHz, 80 W PL2 / Short Burst, 70 W PL1 / Sustained, Raptor Lake-H

Graphics adapter

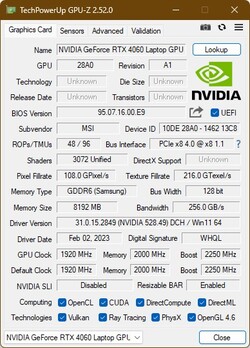
NVIDIA GeForce RTX 4060 Laptop GPU – 8 GB VRAM, Core: 2250 MHz, Memory: 8001 MHz, 105 W TDP ( including 25 W Dynamic Boost), GDDR6, 528.49, Optimus Advanced

Memory

16 GB 

, DDR5-5200, 2x SO-DIMM, Dual Channel

Display

17.30 inch 16:9, 1920 x 1080 pixel 127 PPI, B173HAN04.9, IPS LED, glossy: no, 144 Hz

Mainboard

Intel Alder Lake-P PCH

Soundcard

Intel Alder Lake-P PCH – cAVS (Audio, Voice, Speech)

Connections

1 USB 2.0, 3 USB 3.0 / 3.1 Gen1, 1 HDMI, 1 DisplayPort, Audio Connections: 3.5mm Audio

Networking

Realtek Semiconductor RTL8168/8111 PCI-E Gigabit Ethernet NIC (10/100/1000MBit/s), Intel Wi-Fi 6 AX201 (a/b/g/h/n = Wi-Fi 4/ac = Wi-Fi 5/ax = Wi-Fi 6/), Bluetooth 5.1

Size

height x width x depth (in mm): 25.2 x 398 x 273 ( = 0.99 x 15.67 x 10.75 in)

Battery

53.5 Wh Lithium-Ion

Operating System

Microsoft Windows 11 Home

Additional features

Speakers: Stereo, Keyboard: Chiclet 6 row w/Numpad, 1.7mm travel, Keyboard Light: yes, 240 W Charger, MSI Center, Nahimic, 24 Months Warranty

Weight

2.759 kg ( = 97.32 oz / 6.08 pounds), Power Supply: 573 g ( = 20.21 oz / 1.26 pounds)

Note: The manufacturer may use components from different suppliers including display panels, drives or memory sticks with similar specifications.

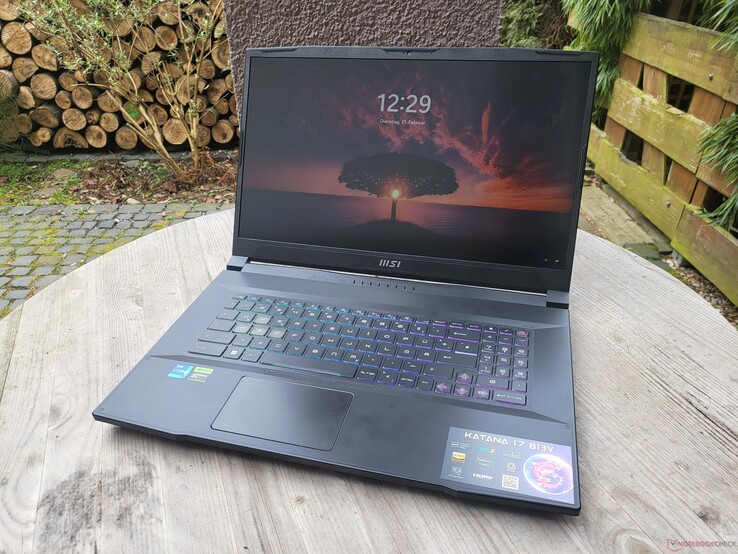
MSI has given the Katana 17 a typical gaming look. The design language can hardly be described as plain but that’s something that doesn’t apply to the laptop’s color: The MSI is dark gray throughout. Although, that’s only the case when the device is switched off. With the colourful, backlit keyboard activated, in terms of color, the MSI also looks like a gaming laptop.

Externally, at least, the laptop is made of plastic. The palm rest and lid feel smooth to the touch whereas the base of the unit is somewhat rougher. It’s not necessarily the highest quality but it serves its purpose nevertheless. When light pressure is applied, the palm rest is firm but with additional pressure, it flexes a little in the middle. The display lid can be twisted slightly, unlike the base which cannot be twisted at all. For a laptop that should spend most of its time on a desk, this ought to be no problem.

The large hinges allow the device to be opened to an angle of 180 degrees and the display lid can be opened with one hand. 

Weight-wise, the MSI Katana 17 sits in the middle of the pack when compared to its peers. In return, it boasts relatively compact dimensions.

Networking
iperf3 transmit AXE11000
Gigabyte G7 KE
Intel Wi-Fi 6E AX211


1636 (1591min – 1674max) MBit/s ∼100% +4%

MSI Titan GT77 HX 13VI
Killer Wi-Fi 6E AX1690i 160MHz


1582 (1517min, 1518.74P1 – 1636max) MBit/s ∼97% +1%

MSI Katana 17 B13VFK
Intel Wi-Fi 6 AX201


1569 (1259min – 1667max) MBit/s ∼96%

Average of class Gaming
  (740 – 1780, n=53, last 2 years)


1356 MBit/s ∼83% -14%

MSI Pulse GL76 12UGK
Intel Wi-Fi 6 AX201


1308 (1166min – 1399max) MBit/s ∼80% -17%

Average Intel Wi-Fi 6 AX201
  (731 – 1715, n=38)


1296 MBit/s ∼79% -17%

iperf3 receive AXE11000
MSI Katana 17 B13VFK
Intel Wi-Fi 6 AX201


1675 (1509min – 1726max) MBit/s ∼100%

Gigabyte G7 KE
Intel Wi-Fi 6E AX211


1655 (1627min – 1681max) MBit/s ∼99% -1%

MSI Titan GT77 HX 13VI
Killer Wi-Fi 6E AX1690i 160MHz


1545 (1508min, 1510.9P1 – 1569max) MBit/s ∼92% -8%

Average of class Gaming
  (685 – 1890, n=60, last 2 years)


1450 MBit/s ∼87% -13%

Average Intel Wi-Fi 6 AX201
  (390 – 1734, n=43)


1441 MBit/s ∼86% -14%

MSI Pulse GL76 12UGK
Intel Wi-Fi 6 AX201


1267 (1119min – 1343max) MBit/s ∼76% -24%

iperf3 transmit AXE11000 6GHz
Asus ROG Strix Scar 17 SE G733CX-LL014W
Intel Wi-Fi 6E AX211


1645 (1589min – 1741max) MBit/s ∼100%

Average of class Gaming
  (980 – 1875, n=25, last 2 years)


1504 MBit/s ∼91%

Acer Predator Helios 300 (i7-12700H, RTX 3070 Ti)
Killer Wi-Fi 6E AX1675i 160MHz Wireless Network Adapter


1350 (1269min – 1405max) MBit/s ∼82%

Average Intel Wi-Fi 6 AX201
  (745 – 1252, n=3)


993 MBit/s ∼60%

iperf3 receive AXE11000 6GHz
Asus ROG Strix Scar 17 SE G733CX-LL014W
Intel Wi-Fi 6E AX211


1732 (1685min – 1744max) MBit/s ∼100%

Average of class Gaming
  (886 – 1857, n=27, last 2 years)


1533 MBit/s ∼89%

Acer Predator Helios 300 (i7-12700H, RTX 3070 Ti)
Killer Wi-Fi 6E AX1675i 160MHz Wireless Network Adapter


1416 (680min – 1453max) MBit/s ∼82%

Average Intel Wi-Fi 6 AX201
  (390 – 1670, n=3)
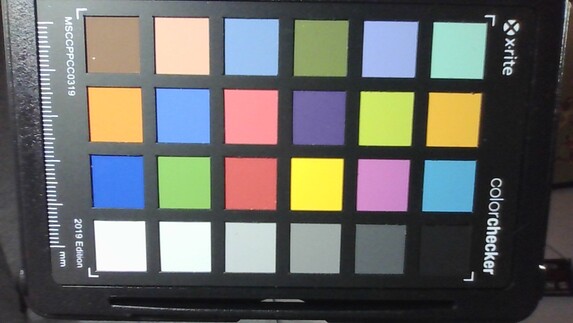


993 MBit/s ∼57%

Out-of-the-box, the MSI Katana 17 B13V comes with a 240-watt power supply unit from Chicony that uses a proprietary connector.

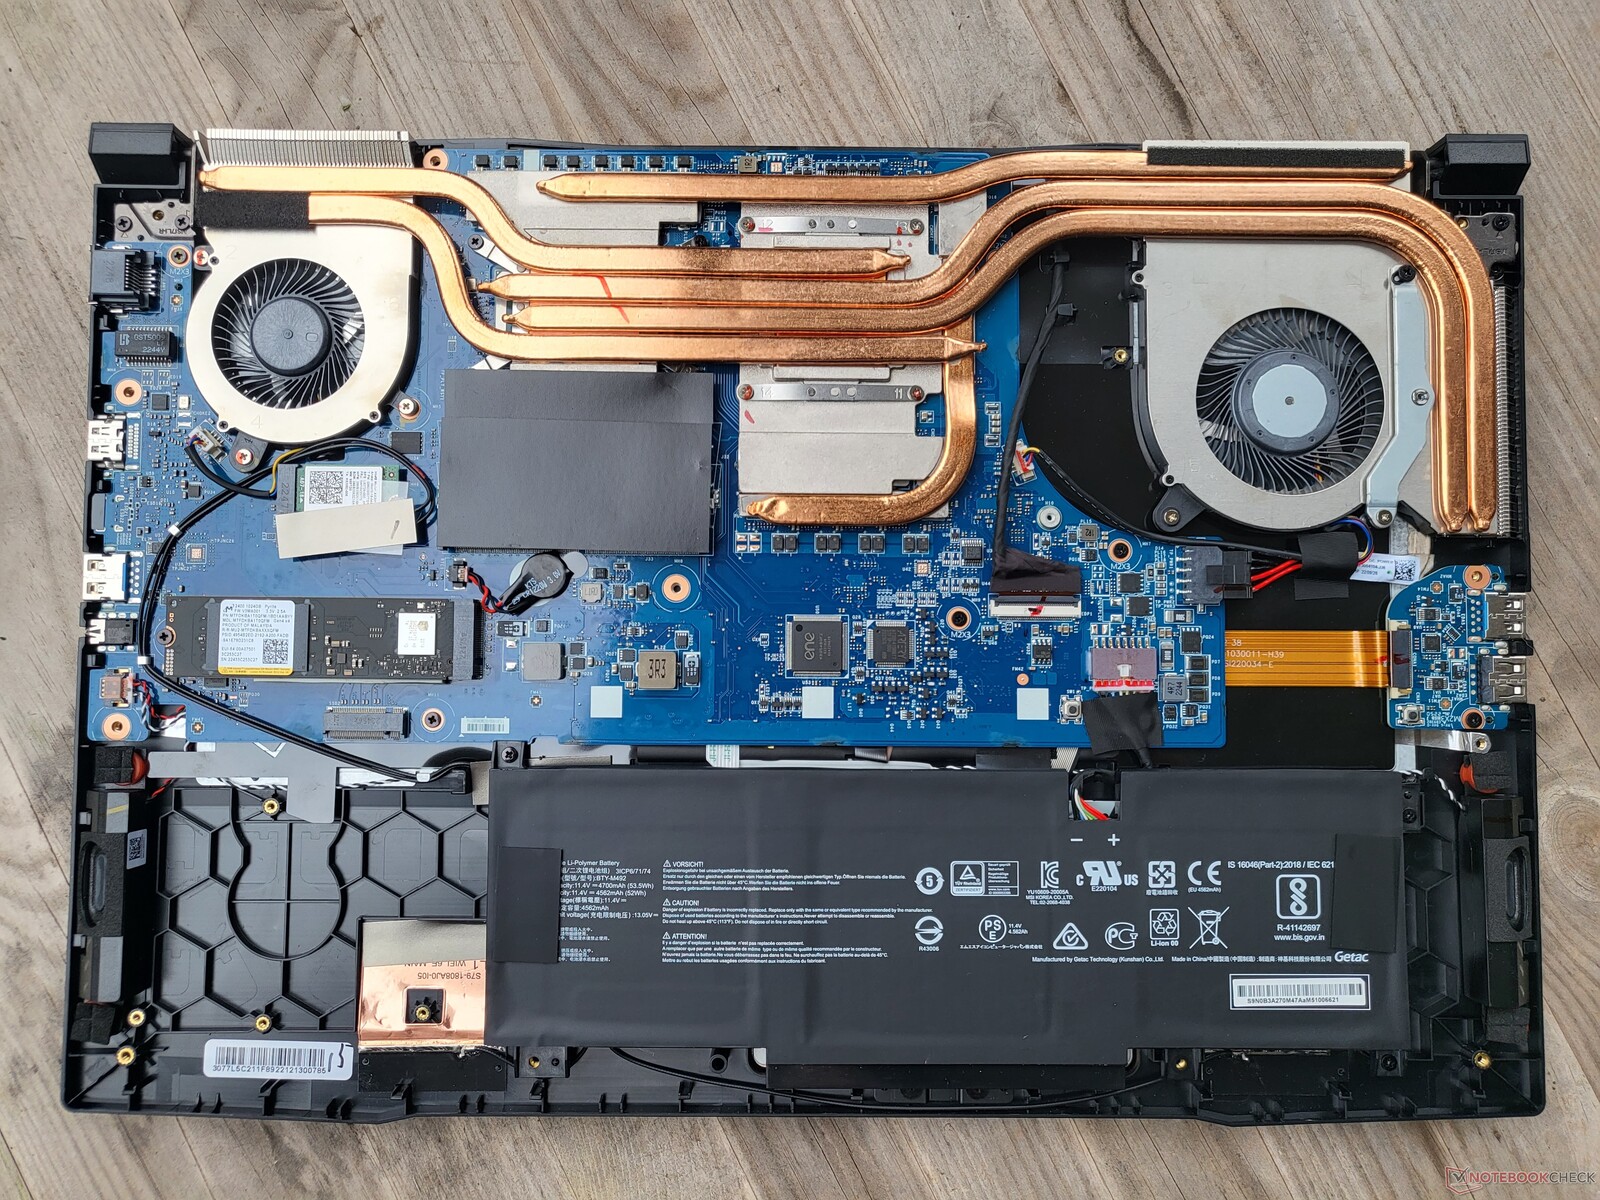
Thirteen screws and a few clips stand in the way of gaining access to the Katana’s internals. The WiFi module, M.2 2280 SSD as well as both RAM modules can be upgraded. Additionally, you can access the large, two-fan cooling system and also the battery which is rather small for a device this size. The is a lot of free space next to the battery which shows a larger battery would have been possible. Interestingly, there is a weight on the base plate which makes the MSI laptop appear heavier – possibly due to the large, free space.

MSI Katana 17: A look inside

The MSI laptop comes with a 2-year guarantee from the date of purchase which includes a Pick-Up & Return service. However, the manufacturer’s guarantee only applies to Germany. 

Firstly the positives: The chiclet keyboard comes complete with multi-level RGB backlighting (four zones, configurable) and offers, by today’s standards, very generous key travel of 1.7 mm. MSI has chosen a very good keyboard for the Katana 17 B13V. The typing experience is wonderful and the WASD key highlighting fits well with the gaming design – as do the relatively large arrow keys. 

However, it is difficult to understand why MSI hasn’t gone with a full-width keyboard. Some keys are clearer smaller than normal, and, in particular, the numeric keypad is tiny. In general, we are left dealing with a very unusual and awkward keyboard layout. The FN key is in an absurd position, the right shift key is considerably smaller, and, to top it all off, it’s an ANSI layout with a narrow enter key meaning the # key is displaced. Not a problem for the worldwide market but very unusual here in Germany. 

MSI Katana 17: Keyboard area

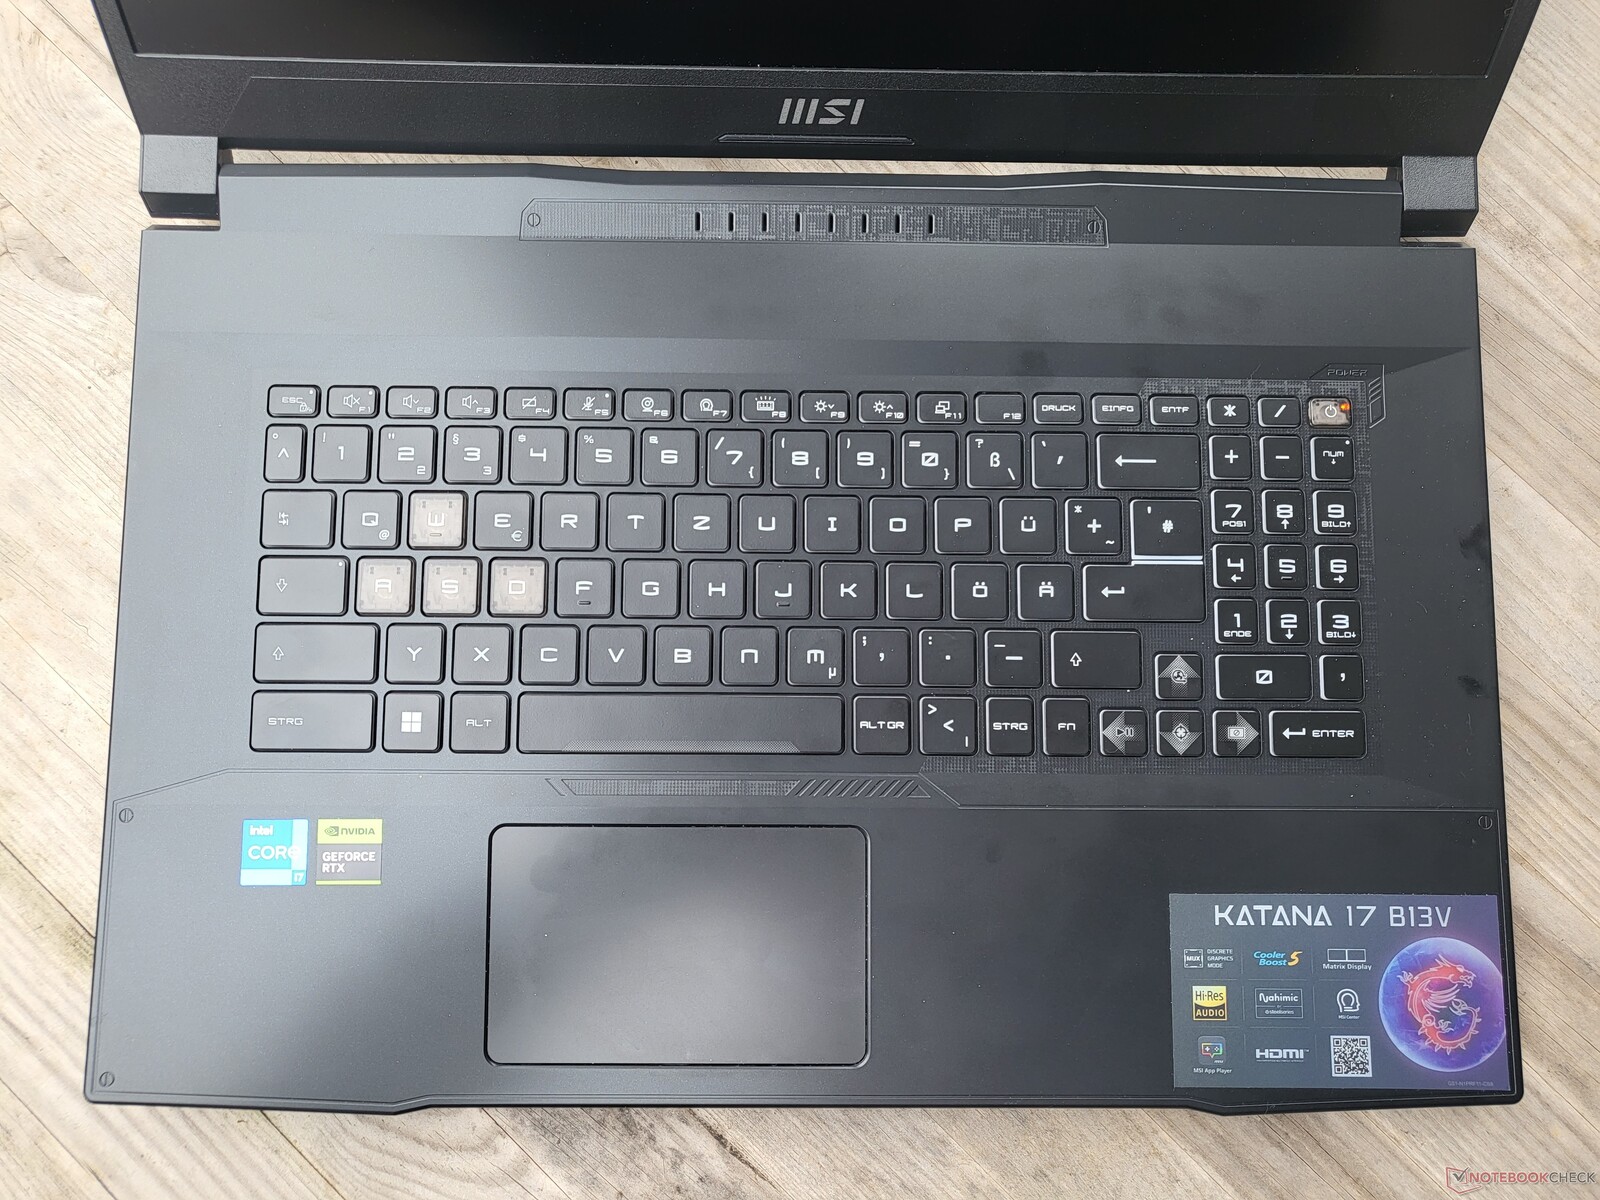
The MSI Katana 17’s touchpad measures 10.5 x 6.5 cm – too small by today’s standards and also in relation to the device’s size. For our tastes, the plastic surface could be a little smoother and also doesn’t feel very premium. At least this doesn’t apply to the click mechanism: The click pad provides an even click and a high-quality feel. There is little to complain about in terms of software implementation, and, in this respect, it’s the typical kind of touchpad found in modern Windows laptops.

For the Katana 17 B13V, MSI only offers one display option and it’s a 17.3-inch, matte, 16:9 format, IPS LCD. The only resolution available is 1920 x 1080, in other words, FullHD. That’s a relatively low resolution for a monitor of this size – although at least it’s a 144 Hz display.

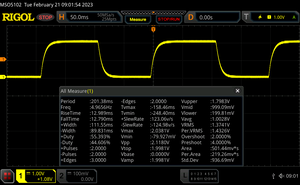
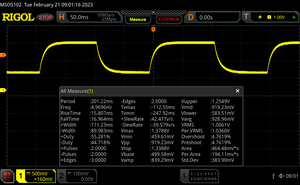
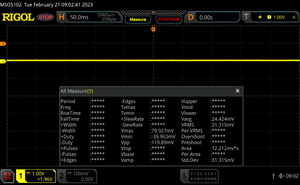
Unfortunately, the quality of AUO’s panel leaves a lot to be desired. At around 256 cd/m², display brightness lags behind the competition. Response times are also poor for a gaming laptop. 

251
cd/m²
247
cd/m²
255
cd/m²
253
cd/m²
267
cd/m²
259
cd/m²
250
cd/m²
262
cd/m²
258
cd/m²

Distribution of brightness

B173HAN04.9

X-Rite i1Pro 2

Maximum: 267 cd/m² (Nits) Average: 255.8 cd/m² Minimum: 12.3 cd/m²
Brightness Distribution: 93 %
Center on Battery: 267 cd/m²
Contrast: 1271:1 (Black: 0.21 cd/m²)
ΔE Color 4.7 | 0.59-29.43 Ø5.2, calibrated: 4.5
ΔE Greyscale 1.5 | 0.57-98 Ø5.4
42.2% AdobeRGB 1998 (Argyll 2.2.0 3D)
61% sRGB (Argyll 2.2.0 3D)
40.8% Display P3 (Argyll 2.2.0 3D)
Gamma: 2.12

MSI Katana 17 B13VFK
B173HAN04.9, IPS LED, 1920×1080, 17.30
MSI Titan GT77 HX 13VI
B173ZAN06.C, Mini-LED, 3840×2160, 17.30
MSI Pulse GL76 12UGK
Sharp LQ173M1JW08, IPS, 1920×1080, 17.30
Gigabyte G7 KE
AU Optronics B173HAN05.1, IPS, 1920×1080, 17.30
Asus ROG Strix Scar 17 SE G733CX-LL014W
NE173QHM-NZ2, IPS, 2560×1440, 17.30
Acer Predator Helios 300 (i7-12700H, RTX 3070 Ti)
BOE0A1A, IPS, 2560×1440, 17.30
Display

105%

72%

69%

101%

101%

Display P3 Coverage

40.8

94.9

133%

71.9

76%

70.4

73%

97.1

138%

96.8

137%

sRGB Coverage

61

99.9

64%

99.9

64%

99.8

64%

99.9

64%

99.9

64%

AdobeRGB 1998 Coverage

42.2

92.4

119%

73.7

75%

71.7

70%

84.8

101%

84.8

101%

Response Times

-9%

72%

77%

72%

54%

Response Time Grey 50% / Grey 80% *

33

In the area of color representation, the display’s less-than-positive impression continues. Even after calibration, the panel is a long away from displaying accurate colors. After calibrating it with i1Profiler and X-Rite i1Pro 2, the DeltaE-Wert dropped only minimally from 4.7 to 4.5.

The cause for this might be the lack of color space coverage. Nowadays, only 61 % of the sRGB color space is an unsatisfactory result – especially for a laptop geared towards media consumption.

Display Response Times

       Response Time Black to White
26 ms … rise ↗ and fall ↘ combined↗ 13 ms rise
↘ 13 ms fall
The screen shows relatively slow response rates in our tests and may be too slow for gamers.
In comparison, all tested devices range from 0.4 (minimum) to 240 (maximum) ms. » 53 % of all devices are better.
This means that the measured response time is worse than the average of all tested devices (22.6 ms).
       Response Time 50% Grey to 80% Grey
33 ms … rise ↗ and fall ↘ combined↗ 16 ms rise
↘ 17 ms fall
The screen shows slow response rates in our tests and will be unsatisfactory for gamers.
In comparison, all tested devices range from 0.25 (minimum) to 636 (maximum) ms. » 33 % of all devices are better.
This means that the measured response time is similar to the average of all tested devices (35.6 ms).

The Intel Core i7-13620H is the entry-level i7 model of the Raptor Lake H series. It has all of the six performance cores but only four of the smaller E cores. As an H CPU, it has a typical TDP of 45 watts, although this can differ greatly, depending on the laptop. All ten cores (16 threads) have a clock rate ranging from 1.8 to 4.9 GHz. You can find additional comparisons with other processors in our CPU list.

MSI has granted the processor a maximum of 80 watts. The resulting performance sits between the i7-12700H in the MSI Pulse GL76 and the i5-12500H found in the Gigabyte G7 KE. Given the specifications and small differences between Alder Lake and Raptor Lake anyway, these results were to be expected. With its eight P-cores and 16 E-cores, the Intel Core i9-13950HX is clearly ahead. 

In battery mode, CPU performance is severely limited. With a total of 1399 points, the Cinebench R15 result was around 40 percent lower. 

02655307951060132515901855212023852650291531803445371039754240450547705035Tooltip
CPU Performance Rating
MSI Titan GT77 HX 13VI
Intel Core i9-13950HX


88.3 pt ∼88%

Asus ROG Strix Scar 17 SE G733CX-LL014W
Intel Core i9-12950HX


68 pt ∼68%

MSI Pulse GL76 12UGK
Intel Core i7-12700H


58.9 pt ∼59%

MSI Katana 17 B13VFK
Intel Core i7-13620H


56.8 pt ∼57%

Average Intel Core i7-13620H


56.8 pt ∼57%

Acer Predator Helios 300 (i7-12700H, RTX 3070 Ti)
Intel Core i7-12700H


55.3 pt ∼55%

Gigabyte G7 KE
Intel Core i5-12500H


53.8 pt ∼54%

Average of class Gaming


50.8 pt ∼51%

Cinebench R23 / Multi Core
MSI Titan GT77 HX 13VI
Intel Core i9-13950HX


33277 Points ∼100% +115%

Asus ROG Strix Scar 17 SE G733CX-LL014W
Intel Core i9-12950HX


19965 Points ∼60% +29%

Acer Predator Helios 300 (i7-12700H, RTX 3070 Ti)
Intel Core i7-12700H


17133 Points ∼51% +11%

MSI Pulse GL76 12UGK
Intel Core i7-12700H


17075 (15585.9min – 17075max) Points ∼51% +10%

MSI Katana 17 B13VFK
Intel Core i7-13620H


15496 Points ∼47%

Average Intel Core i7-13620H


15496 Points ∼47% 0%

Gigabyte G7 KE
Intel Core i5-12500H


14232 Points ∼43% -8%

Average of class Gaming
  (2435 – 33277, n=212, last 2 years)


14036 Points ∼42% -9%

Cinebench R23 / Single Core
MSI Titan GT77 HX 13VI
Intel Core i9-13950HX


2100 Points ∼100% +16%

Asus ROG Strix Scar 17 SE G733CX-LL014W
Intel Core i9-12950HX


1903 Points ∼91% +5%

MSI Katana 17 B13VFK
Intel Core i7-13620H


1805 Points ∼86%

Average Intel Core i7-13620H


1805 Points ∼86% 0%

Acer Predator Helios 300 (i7-12700H, RTX 3070 Ti)
Intel Core i7-12700H


1750 Points ∼83% -3%

MSI Pulse GL76 12UGK
Intel Core i7-12700H


1711 Points ∼81% -5%

Gigabyte G7 KE
Intel Core i5-12500H


1701 Points ∼81% -6%

Average of class Gaming
  (527 – 2140, n=211, last 2 years)


1594 Points ∼76% -12%

Cinebench R20 / CPU (Multi Core)
MSI Titan GT77 HX 13VI
Intel Core i9-13950HX


12648 Points ∼100% +114%

Asus ROG Strix Scar 17 SE G733CX-LL014W
Intel Core i9-12950HX


7511 Points ∼59% +27%

MSI Pulse GL76 12UGK
Intel Core i7-12700H


6570 Points ∼52% +11%

MSI Katana 17 B13VFK
Intel Core i7-13620H


5905 Points ∼47%

Average Intel Core i7-13620H


5905 Points ∼47% 0%

Acer Predator Helios 300 (i7-12700H, RTX 3070 Ti)
Intel Core i7-12700H


5846 Points ∼46% -1%

Gigabyte G7 KE
Intel Core i5-12500H


5368 Points ∼42% -9%

Average of class Gaming
  (930 – 12648, n=218, last 2 years)


5337 Points ∼42% -10%

Cinebench R20 / CPU (Single Core)
MSI Titan GT77 HX 13VI
Intel Core i9-13950HX


803 Points ∼100% +16%

Asus ROG Strix Scar 17 SE G733CX-LL014W
Intel Core i9-12950HX


741 Points ∼92% +7%

Acer Predator Helios 300 (i7-12700H, RTX 3070 Ti)
Intel Core i7-12700H


697 Points ∼87% +1%

MSI Katana 17 B13VFK
Intel Core i7-13620H


693 Points ∼86%

Average Intel Core i7-13620H


693 Points ∼86% 0%

MSI Pulse GL76 12UGK
Intel Core i7-12700H


664 Points ∼83% -4%

Gigabyte G7 KE
Intel Core i5-12500H


654 Points ∼81% -6%

Average of class Gaming
  (169 – 824, n=218, last 2 years)


615 Points ∼77% -11%

Cinebench R15 / CPU Multi 64Bit
MSI Titan GT77 HX 13VI
Intel Core i9-13950HX


5227 (4889.98min – 5226.71max) Points ∼100% +123%

Asus ROG Strix Scar 17 SE G733CX-LL014W
Intel Core i9-12950HX


3101 (2605.18min – 3101.02max) Points ∼59% +32%

Acer Predator Helios 300 (i7-12700H, RTX 3070 Ti)
Intel Core i7-12700H


2886 Points ∼55% +23%

MSI Pulse GL76 12UGK
Intel Core i7-12700H


2694 (2457.61min – 2693.6max) Points ∼52% +15%

MSI Katana 17 B13VFK
Intel Core i7-13620H


2349 (2246.31min – 2349.07max) Points ∼45%

Average Intel Core i7-13620H


2349 Points ∼45% 0%

Average of class Gaming
  (400 – 5227, n=219, last 2 years)


2251 Points ∼43% -4%

Gigabyte G7 KE
Intel Core i5-12500H


2197 Points ∼42% -6%

Cinebench R15 / CPU Single 64Bit
MSI Titan GT77 HX 13VI
Intel Core i9-13950HX


300 Points ∼100% +16%

Asus ROG Strix Scar 17 SE G733CX-LL014W
Intel Core i9-12950HX


274 Points ∼91% +6%

MSI Katana 17 B13VFK
Intel Core i7-13620H


258 Points ∼86%

Average Intel Core i7-13620H


258 Points ∼86% 0%

MSI Pulse GL76 12UGK
Intel Core i7-12700H


255 Points ∼85% -1%

Acer Predator Helios 300 (i7-12700H, RTX 3070 Ti)
Intel Core i7-12700H


254 Points ∼85% -2%

Gigabyte G7 KE
Intel Core i5-12500H


250 Points ∼83% -3%

Average of class Gaming
  (79.2 – 312, n=215, last 2 years)


241 Points ∼80% -7%

Blender / v2.79 BMW27 CPU
Average of class Gaming
  (100 – 1259, n=219, last 2 years)


257 Seconds * ∼100% -20%

Gigabyte G7 KE
Intel Core i5-12500H


225 Seconds * ∼88% -5%

MSI Katana 17 B13VFK
Intel Core i7-13620H


215 Seconds * ∼84%

Average Intel Core i7-13620H


215 Seconds * ∼84% -0%

Acer Predator Helios 300 (i7-12700H, RTX 3070 Ti)
Intel Core i7-12700H


213 Seconds * ∼83% +1%

MSI Pulse GL76 12UGK
Intel Core i7-12700H


190 Seconds * ∼74% +12%

Asus ROG Strix Scar 17 SE G733CX-LL014W
Intel Core i9-12950HX


175 Seconds * ∼68% +19%

MSI Titan GT77 HX 13VI
Intel Core i9-13950HX


100 Seconds * ∼39% +53%

7-Zip 18.03 / 7z b 4
MSI Titan GT77 HX 13VI
Intel Core i9-13950HX


127295 MIPS ∼100% +104%

Asus ROG Strix Scar 17 SE G733CX-LL014W
Intel Core i9-12950HX


77003 MIPS ∼60% +24%

Acer Predator Helios 300 (i7-12700H, RTX 3070 Ti)
Intel Core i7-12700H


67427 MIPS ∼53% +8%

MSI Pulse GL76 12UGK
Intel Core i7-12700H


65292 MIPS ∼51% +5%

MSI Katana 17 B13VFK
Intel Core i7-13620H


62324 MIPS ∼49%

Average Intel Core i7-13620H


62324 MIPS ∼49% 0%

Average of class Gaming
  (11386 – 127295, n=215, last 2 years)


58270 MIPS ∼46% -7%

Gigabyte G7 KE
Intel Core i5-12500H


53712 MIPS ∼42% -14%

7-Zip 18.03 / 7z b 4 -mmt1
MSI Titan GT77 HX 13VI
Intel Core i9-13950HX


6897 MIPS ∼100% +20%

Asus ROG Strix Scar 17 SE G733CX-LL014W
Intel Core i9-12950HX


6255 MIPS ∼91% +9%

Acer Predator Helios 300 (i7-12700H, RTX 3070 Ti)
Intel Core i7-12700H


5760 MIPS ∼84% 0%

MSI Katana 17 B13VFK
Intel Core i7-13620H


5742 MIPS ∼83%

Average Intel Core i7-13620H


5742 MIPS ∼83% 0%

MSI Pulse GL76 12UGK
Intel Core i7-12700H


5672 MIPS ∼82% -1%

Average of class Gaming
  (2685 – 7084, n=216, last 2 years)


5639 MIPS ∼82% -2%

Gigabyte G7 KE
Intel Core i5-12500H


5563 MIPS ∼81% -3%

Geekbench 5.4 / Multi-Core
MSI Titan GT77 HX 13VI
Intel Core i9-13950HX


20634 Points ∼100% +83%

Asus ROG Strix Scar 17 SE G733CX-LL014W
Intel Core i9-12950HX


15144 Points ∼73% +34%

Acer Predator Helios 300 (i7-12700H, RTX 3070 Ti)
Intel Core i7-12700H


13414 Points ∼65% +19%

MSI Pulse GL76 12UGK
Intel Core i7-12700H


11979 Points ∼58% +6%

MSI Katana 17 B13VFK
Intel Core i7-13620H


11289 Points ∼55%

Average Intel Core i7-13620H


11289 Points ∼55% 0%

Gigabyte G7 KE
Intel Core i5-12500H


10284 Points ∼50% -9%

Average of class Gaming
  (1946 – 21058, n=211, last 2 years)


10164 Points ∼49% -10%

Geekbench 5.4 / Single-Core
MSI Titan GT77 HX 13VI
Intel Core i9-13950HX


2043 Points ∼100% +14%

Asus ROG Strix Scar 17 SE G733CX-LL014W
Intel Core i9-12950HX


1868 Points ∼91% +4%

MSI Katana 17 B13VFK
Intel Core i7-13620H


1793 Points ∼88%

Average Intel Core i7-13620H


1793 Points ∼88% 0%

Acer Predator Helios 300 (i7-12700H, RTX 3070 Ti)
Intel Core i7-12700H


1723 Points ∼84% -4%

Gigabyte G7 KE
Intel Core i5-12500H


1683 Points ∼82% -6%

MSI Pulse GL76 12UGK
Intel Core i7-12700H


1683 Points ∼82% -6%

Average of class Gaming
  (158 – 2108, n=211, last 2 years)


1603 Points ∼78% -11%

HWBOT x265 Benchmark v2.2 / 4k Preset
MSI Titan GT77 HX 13VI
Intel Core i9-13950HX


32.7 fps ∼100% +91%

Asus ROG Strix Scar 17 SE G733CX-LL014W
Intel Core i9-12950HX


22.5 fps ∼69% +32%

MSI Pulse GL76 12UGK
Intel Core i7-12700H


19 fps ∼58% +11%

MSI Katana 17 B13VFK
Intel Core i7-13620H


17.1 fps ∼52%

Average Intel Core i7-13620H


17.1 fps ∼52% 0%

Gigabyte G7 KE
Intel Core i5-12500H


16.6 fps ∼51% -3%

Acer Predator Helios 300 (i7-12700H, RTX 3070 Ti)
Intel Core i7-12700H


16.5 fps ∼50% -4%

Average of class Gaming
  (3 – 33.4, n=218, last 2 years)


16.2 fps ∼50% -5%

LibreOffice / 20 Documents To PDF
Acer Predator Helios 300 (i7-12700H, RTX 3070 Ti)
Intel Core i7-12700H


95.3 s * ∼100% -68%

MSI Katana 17 B13VFK
Intel Core i7-13620H


56.8 s * ∼60%

Average Intel Core i7-13620H


56.8 s * ∼60% -0%

Average of class Gaming
  (33.6 – 332, n=215, last 2 years)


51.7 s * ∼54% +9%

MSI Titan GT77 HX 13VI
Intel Core i9-13950HX


46.5 s * ∼49% +18%

MSI Pulse GL76 12UGK
Intel Core i7-12700H


45.8 s * ∼48% +19%

Gigabyte G7 KE
Intel Core i5-12500H


45.5 s * ∼48% +20%

Asus ROG Strix Scar 17 SE G733CX-LL014W
Intel Core i9-12950HX


34.7 s * ∼36% +39%

R Benchmark 2.5 / Overall mean
Average of class Gaming
  (0.3793 – 4.47, n=214, last 2 years)


0.526 sec * ∼100% -19%

Gigabyte G7 KE
Intel Core i5-12500H


0.4748 sec * ∼90% -7%

MSI Pulse GL76 12UGK
Intel Core i7-12700H


0.473 sec * ∼90% -7%

Acer Predator Helios 300 (i7-12700H, RTX 3070 Ti)
Intel Core i7-12700H


0.4556 sec * ∼87% -3%

MSI Katana 17 B13VFK
Intel Core i7-13620H


0.4438 sec * ∼84%

Average Intel Core i7-13620H


0.4438 sec * ∼84% -0%

Asus ROG Strix Scar 17 SE G733CX-LL014W
Intel Core i9-12950HX


0.4251 sec * ∼81% +4%

MSI Titan GT77 HX 13VI
Intel Core i9-13950HX


0.4033 sec * ∼77% +9%

* … smaller is better

Cinebench R10 Rendering Multiple CPUs 32Bit

54809

Cinebench R10 Shading 32Bit

16072

Cinebench R10 Rendering Single 32Bit

10181

Cinebench R11.5 CPU Multi 64Bit

27.06 Points

Cinebench R11.5 OpenGL 64Bit

3.27 fps

Cinebench R11.5 CPU Single 64Bit

3.27 Points

Cinebench R15 CPU Single 64Bit

258 Points

Cinebench R15 Ref. Match 64Bit

99.6 %

Cinebench R15 OpenGL 64Bit

204 fps

Cinebench R15 CPU Multi 64Bit

2349 Points

Help

Performance Rating
MSI Titan GT77 HX 13VI
Intel Core i9-13950HX, NVIDIA GeForce RTX 4090 Laptop GPU


97.8 pt ∼98%

Asus ROG Strix Scar 17 SE G733CX-LL014W
Intel Core i9-12950HX, GeForce RTX 3080 Ti Laptop GPU


70.2 pt ∼70%

Acer Predator Helios 300 (i7-12700H, RTX 3070 Ti)
Intel Core i7-12700H, GeForce RTX 3070 Ti Laptop GPU


63 pt ∼63%

MSI Pulse GL76 12UGK
Intel Core i7-12700H, GeForce RTX 3070 Laptop GPU


61.1 pt ∼61%

Average of class Gaming


53.3 pt ∼53%

Gigabyte G7 KE
Intel Core i5-12500H, GeForce RTX 3060 Laptop GPU


50.6 pt ∼51%

MSI Katana 17 B13VFK
Intel Core i7-13620H, NVIDIA GeForce RTX 4060 Laptop GPU


48.8 pt ∼49%

Average Intel Core i7-13620H


48.8 pt ∼49%

AIDA64 / FP32 Ray-Trace
MSI Titan GT77 HX 13VI
Intel Core i9-13950HX, NVIDIA GeForce RTX 4090 Laptop GPU


28957 KRay/s ∼100% +113%

Asus ROG Strix Scar 17 SE G733CX-LL014W
Intel Core i9-12950HX, GeForce RTX 3080 Ti Laptop GPU


17542 KRay/s ∼61% +29%

Acer Predator Helios 300 (i7-12700H, RTX 3070 Ti)
Intel Core i7-12700H, GeForce RTX 3070 Ti Laptop GPU


17329 KRay/s ∼60% +27%

MSI Pulse GL76 12UGK
Intel Core i7-12700H, GeForce RTX 3070 Laptop GPU


16483 KRay/s ∼57% +21%

MSI Katana 17 B13VFK
Intel Core i7-13620H, NVIDIA GeForce RTX 4060 Laptop GPU


13601 KRay/s ∼47%

Average Intel Core i7-13620H


13601 KRay/s ∼47% 0%

Gigabyte G7 KE
Intel Core i5-12500H, GeForce RTX 3060 Laptop GPU


13017 KRay/s ∼45% -4%

Average of class Gaming
  (2585 – 28957, n=191, last 2 years)


12950 KRay/s ∼45% -5%

AIDA64 / FPU Julia
MSI Titan GT77 HX 13VI
Intel Core i9-13950HX, NVIDIA GeForce RTX 4090 Laptop GPU


144303 Points ∼100% +115%

Acer Predator Helios 300 (i7-12700H, RTX 3070 Ti)
Intel Core i7-12700H, GeForce RTX 3070 Ti Laptop GPU


90760 Points ∼63% +35%

Asus ROG Strix Scar 17 SE G733CX-LL014W
Intel Core i9-12950HX, GeForce RTX 3080 Ti Laptop GPU


86936 Points ∼60% +29%

MSI Pulse GL76 12UGK
Intel Core i7-12700H, GeForce RTX 3070 Laptop GPU


80935 Points ∼56% +20%

Average of class Gaming
  (12439 – 144303, n=191, last 2 years)


69667 Points ∼48% +4%

MSI Katana 17 B13VFK
Intel Core i7-13620H, NVIDIA GeForce RTX 4060 Laptop GPU


67187 Points ∼47%

Average Intel Core i7-13620H


67187 Points ∼47% 0%

Gigabyte G7 KE
Intel Core i5-12500H, GeForce RTX 3060 Laptop GPU


65572 Points ∼45% -2%

AIDA64 / CPU SHA3
MSI Titan GT77 HX 13VI
Intel Core i9-13950HX, NVIDIA GeForce RTX 4090 Laptop GPU


7093 MB/s ∼100% +156%

Asus ROG Strix Scar 17 SE G733CX-LL014W
Intel Core i9-12950HX, GeForce RTX 3080 Ti Laptop GPU


4179 MB/s ∼59% +51%

Acer Predator Helios 300 (i7-12700H, RTX 3070 Ti)
Intel Core i7-12700H, GeForce RTX 3070 Ti Laptop GPU


4002 MB/s ∼56% +44%

MSI Pulse GL76 12UGK
Intel Core i7-12700H, GeForce RTX 3070 Laptop GPU


3854 MB/s ∼54% +39%

Average of class Gaming
  (629 – 7093, n=191, last 2 years)


3279 MB/s ∼46% +18%

Gigabyte G7 KE
Intel Core i5-12500H, GeForce RTX 3060 Laptop GPU


3236 MB/s ∼46% +17%

MSI Katana 17 B13VFK
Intel Core i7-13620H, NVIDIA GeForce RTX 4060 Laptop GPU


2773 MB/s ∼39%

Average Intel Core i7-13620H


2773 MB/s ∼39% 0%

AIDA64 / CPU Queen
MSI Titan GT77 HX 13VI
Intel Core i9-13950HX, NVIDIA GeForce RTX 4090 Laptop GPU


139649 Points ∼100% +78%

Asus ROG Strix Scar 17 SE G733CX-LL014W
Intel Core i9-12950HX, GeForce RTX 3080 Ti Laptop GPU


104422 Points ∼75% +33%

MSI Pulse GL76 12UGK
Intel Core i7-12700H, GeForce RTX 3070 Laptop GPU


103119 Points ∼74% +32%

Acer Predator Helios 300 (i7-12700H, RTX 3070 Ti)
Intel Core i7-12700H, GeForce RTX 3070 Ti Laptop GPU


102178 Points ∼73% +30%

Average of class Gaming
  (15371 – 141905, n=191, last 2 years)


95497 Points ∼68% +22%

Gigabyte G7 KE
Intel Core i5-12500H, GeForce RTX 3060 Laptop GPU


80285 Points ∼57% +2%

MSI Katana 17 B13VFK
Intel Core i7-13620H, NVIDIA GeForce RTX 4060 Laptop GPU


78352 Points ∼56%

Average Intel Core i7-13620H


78352 Points ∼56% 0%

AIDA64 / FPU SinJulia
MSI Titan GT77 HX 13VI
Intel Core i9-13950HX, NVIDIA GeForce RTX 4090 Laptop GPU


17057 Points ∼100% +103%

Asus ROG Strix Scar 17 SE G733CX-LL014W
Intel Core i9-12950HX, GeForce RTX 3080 Ti Laptop GPU


11502 Points ∼67% +37%

Average of class Gaming
  (2137 – 17639, n=191, last 2 years)


10405 Points ∼61% +24%

Acer Predator Helios 300 (i7-12700H, RTX 3070 Ti)
Intel Core i7-12700H, GeForce RTX 3070 Ti Laptop GPU


9939 Points ∼58% +18%

MSI Pulse GL76 12UGK
Intel Core i7-12700H, GeForce RTX 3070 Laptop GPU


9811 Points ∼58% +17%

MSI Katana 17 B13VFK
Intel Core i7-13620H, NVIDIA GeForce RTX 4060 Laptop GPU


8421 Points ∼49%

Average Intel Core i7-13620H


8421 Points ∼49% 0%

Gigabyte G7 KE
Intel Core i5-12500H, GeForce RTX 3060 Laptop GPU


7390 Points ∼43% -12%

AIDA64 / FPU Mandel
MSI Titan GT77 HX 13VI
Intel Core i9-13950HX, NVIDIA GeForce RTX 4090 Laptop GPU


71038 Points ∼100% +117%

Acer Predator Helios 300 (i7-12700H, RTX 3070 Ti)
Intel Core i7-12700H, GeForce RTX 3070 Ti Laptop GPU


44760 Points ∼63% +37%

Asus ROG Strix Scar 17 SE G733CX-LL014W
Intel Core i9-12950HX, GeForce RTX 3080 Ti Laptop GPU


42613 Points ∼60% +30%

MSI Pulse GL76 12UGK
Intel Core i7-12700H, GeForce RTX 3070 Laptop GPU


39765 Points ∼56% +21%

Average of class Gaming
  (7135 – 71038, n=191, last 2 years)


37763 Points ∼53% +15%

MSI Katana 17 B13VFK
Intel Core i7-13620H, NVIDIA GeForce RTX 4060 Laptop GPU


32787 Points ∼46%

Average Intel Core i7-13620H


32787 Points ∼46% 0%

Gigabyte G7 KE
Intel Core i5-12500H, GeForce RTX 3060 Laptop GPU


32002 Points ∼45% -2%

AIDA64 / CPU AES
Asus ROG Strix Scar 17 SE G733CX-LL014W
Intel Core i9-12950HX, GeForce RTX 3080 Ti Laptop GPU


167077 MB/s ∼100% +185%

MSI Pulse GL76 12UGK
Intel Core i7-12700H, GeForce RTX 3070 Laptop GPU


137201 MB/s ∼82% +134%

MSI Titan GT77 HX 13VI
Intel Core i9-13950HX, NVIDIA GeForce RTX 4090 Laptop GPU


136551 MB/s ∼82% +133%

Gigabyte G7 KE
Intel Core i5-12500H, GeForce RTX 3060 Laptop GPU


110707 MB/s ∼66% +89%

Average of class Gaming
  (18146 – 183146, n=191, last 2 years)


97947 MB/s ∼59% +67%

Acer Predator Helios 300 (i7-12700H, RTX 3070 Ti)
Intel Core i7-12700H, GeForce RTX 3070 Ti Laptop GPU


81465 MB/s ∼49% +39%

MSI Katana 17 B13VFK
Intel Core i7-13620H, NVIDIA GeForce RTX 4060 Laptop GPU


58525 MB/s ∼35%

Average Intel Core i7-13620H


58525 MB/s ∼35% 0%

AIDA64 / CPU ZLib
MSI Titan GT77 HX 13VI
Intel Core i9-13950HX, NVIDIA GeForce RTX 4090 Laptop GPU


2059 MB/s ∼100% +152%

Asus ROG Strix Scar 17 SE G733CX-LL014W
Intel Core i9-12950HX, GeForce RTX 3080 Ti Laptop GPU


1205 MB/s ∼59% +47%

Acer Predator Helios 300 (i7-12700H, RTX 3070 Ti)
Intel Core i7-12700H, GeForce RTX 3070 Ti Laptop GPU


1159 MB/s ∼56% +42%

MSI Pulse GL76 12UGK
Intel Core i7-12700H, GeForce RTX 3070 Laptop GPU


1089 MB/s ∼53% +33%

Gigabyte G7 KE
Intel Core i5-12500H, GeForce RTX 3060 Laptop GPU


921 MB/s ∼45% +13%

MSI Katana 17 B13VFK
Intel Core i7-13620H, NVIDIA GeForce RTX 4060 Laptop GPU


818 MB/s ∼40%

Average Intel Core i7-13620H


818 MB/s ∼40% 0%

Average of class Gaming
  (150.9 – 2059, n=212, last 2 years)


818 MB/s ∼40% 0%

AIDA64 / FP64 Ray-Trace
MSI Titan GT77 HX 13VI
Intel Core i9-13950HX, NVIDIA GeForce RTX 4090 Laptop GPU


15573 KRay/s ∼100% +111%

Acer Predator Helios 300 (i7-12700H, RTX 3070 Ti)
Intel Core i7-12700H, GeForce RTX 3070 Ti Laptop GPU


9589 KRay/s ∼62% +30%

Asus ROG Strix Scar 17 SE G733CX-LL014W
Intel Core i9-12950HX, GeForce RTX 3080 Ti Laptop GPU


9507 KRay/s ∼61% +29%

MSI Pulse GL76 12UGK
Intel Core i7-12700H, GeForce RTX 3070 Laptop GPU


8867 KRay/s ∼57% +20%

MSI Katana 17 B13VFK
Intel Core i7-13620H, NVIDIA GeForce RTX 4060 Laptop GPU


7364 KRay/s ∼47%

Average Intel Core i7-13620H


7364 KRay/s ∼47% 0%

Average of class Gaming
  (1437 – 15573, n=191, last 2 years)


7042 KRay/s ∼45% -4%

Gigabyte G7 KE
Intel Core i5-12500H, GeForce RTX 3060 Laptop GPU


6932 KRay/s ∼45% -6%

AIDA64 / CPU PhotoWorxx
Asus ROG Strix Scar 17 SE G733CX-LL014W
Intel Core i9-12950HX, GeForce RTX 3080 Ti Laptop GPU


42438 MPixel/s ∼100% +23%

MSI Titan GT77 HX 13VI
Intel Core i9-13950HX, NVIDIA GeForce RTX 4090 Laptop GPU


40896 MPixel/s ∼96% +18%

Acer Predator Helios 300 (i7-12700H, RTX 3070 Ti)
Intel Core i7-12700H, GeForce RTX 3070 Ti Laptop GPU


38193 MPixel/s ∼90% +11%

MSI Katana 17 B13VFK
Intel Core i7-13620H, NVIDIA GeForce RTX 4060 Laptop GPU


34544 MPixel/s ∼81%

Average Intel Core i7-13620H


34544 MPixel/s ∼81% 0%

Gigabyte G7 KE
Intel Core i5-12500H, GeForce RTX 3060 Laptop GPU


29206 MPixel/s ∼69% -15%

Average of class Gaming
  (8341 – 51096, n=191, last 2 years)


28843 MPixel/s ∼68% -17%

MSI Pulse GL76 12UGK
Intel Core i7-12700H, GeForce RTX 3070 Laptop GPU


27269 MPixel/s ∼64% -21%

A fast SSD, paired with the Katana 17’s powerful graphics chip, result in very good system performance which is, of course, somewhat behind the better-configured competition in synthetic benchmarks.

PCMark 10 / Score
MSI Titan GT77 HX 13VI
NVIDIA GeForce RTX 4090 Laptop GPU, i9-13950HX, Samsung PM9A1 MZVL22T0HBLB


8884 Points ∼100% +24%

Acer Predator Helios 300 (i7-12700H, RTX 3070 Ti)
GeForce RTX 3070 Ti Laptop GPU, i7-12700H, Samsung PM9A1 MZVL21T0HCLR


7899 Points ∼89% +10%

MSI Pulse GL76 12UGK
GeForce RTX 3070 Laptop GPU, i7-12700H, Micron 3400 1TB MTFDKBA1T0TFH


7647 Points ∼86% +7%

Asus ROG Strix Scar 17 SE G733CX-LL014W
GeForce RTX 3080 Ti Laptop GPU, i9-12950HX, Samsung PM9A1 MZVL22T0HBLB


7208 Points ∼81% +1%

MSI Katana 17 B13VFK
NVIDIA GeForce RTX 4060 Laptop GPU, i7-13620H, Micron 2400 MTFDKBA1T0QFM


7160 Points ∼81%

Average Intel Core i7-13620H, NVIDIA GeForce RTX 4060 Laptop GPU


7160 Points ∼81% 0%

Average of class Gaming
  (4477 – 8884, n=177, last 2 years)


7076 Points ∼80% -1%

Gigabyte G7 KE
GeForce RTX 3060 Laptop GPU, i5-12500H, Gigabyte AG470S1TB-SI B10


6126 Points ∼69% -14%

PCMark 10 / Essentials
MSI Titan GT77 HX 13VI
NVIDIA GeForce RTX 4090 Laptop GPU, i9-13950HX, Samsung PM9A1 MZVL22T0HBLB


11761 Points ∼100% +9%

MSI Pulse GL76 12UGK
GeForce RTX 3070 Laptop GPU, i7-12700H, Micron 3400 1TB MTFDKBA1T0TFH


10926 Points ∼93% +1%

MSI Katana 17 B13VFK
NVIDIA GeForce RTX 4060 Laptop GPU, i7-13620H, Micron 2400 MTFDKBA1T0QFM


10809 Points ∼92%

Average Intel Core i7-13620H, NVIDIA GeForce RTX 4060 Laptop GPU


10809 Points ∼92% 0%

Acer Predator Helios 300 (i7-12700H, RTX 3070 Ti)
GeForce RTX 3070 Ti Laptop GPU, i7-12700H, Samsung PM9A1 MZVL21T0HCLR


10679 Points ∼91% -1%

Asus ROG Strix Scar 17 SE G733CX-LL014W
GeForce RTX 3080 Ti Laptop GPU, i9-12950HX, Samsung PM9A1 MZVL22T0HBLB


10306 Points ∼88% -5%

Gigabyte G7 KE
GeForce RTX 3060 Laptop GPU, i5-12500H, Gigabyte AG470S1TB-SI B10


10301 Points ∼88% -5%

Average of class Gaming
  (7334 – 11761, n=176, last 2 years)


10254 Points ∼87% -5%

PCMark 10 / Productivity
Acer Predator Helios 300 (i7-12700H, RTX 3070 Ti)
GeForce RTX 3070 Ti Laptop GPU, i7-12700H, Samsung PM9A1 MZVL21T0HCLR


9984 Points ∼100% +7%

MSI Pulse GL76 12UGK
GeForce RTX 3070 Laptop GPU, i7-12700H, Micron 3400 1TB MTFDKBA1T0TFH


9877 Points ∼99% +6%

Asus ROG Strix Scar 17 SE G733CX-LL014W
GeForce RTX 3080 Ti Laptop GPU, i9-12950HX, Samsung PM9A1 MZVL22T0HBLB


9856 Points ∼99% +6%

MSI Titan GT77 HX 13VI
NVIDIA GeForce RTX 4090 Laptop GPU, i9-13950HX, Samsung PM9A1 MZVL22T0HBLB


9851 Points ∼99% +6%

MSI Katana 17 B13VFK
NVIDIA GeForce RTX 4060 Laptop GPU, i7-13620H, Micron 2400 MTFDKBA1T0QFM


9308 Points ∼93%

Average Intel Core i7-13620H, NVIDIA GeForce RTX 4060 Laptop GPU


9308 Points ∼93% 0%

Average of class Gaming
  (6161 – 10932, n=176, last 2 years)


9261 Points ∼93% -1%

Gigabyte G7 KE
GeForce RTX 3060 Laptop GPU, i5-12500H, Gigabyte AG470S1TB-SI B10


9038 Points ∼91% -3%

PCMark 10 / Digital Content Creation
MSI Titan GT77 HX 13VI
NVIDIA GeForce RTX 4090 Laptop GPU, i9-13950HX, Samsung PM9A1 MZVL22T0HBLB


16424 Points ∼100% +66%

Acer Predator Helios 300 (i7-12700H, RTX 3070 Ti)
GeForce RTX 3070 Ti Laptop GPU, i7-12700H, Samsung PM9A1 MZVL21T0HCLR


12546 Points ∼76% +27%

MSI Pulse GL76 12UGK
GeForce RTX 3070 Laptop GPU, i7-12700H, Micron 3400 1TB MTFDKBA1T0TFH


11245 Points ∼68% +14%

Average of class Gaming
  (5288 – 16424, n=176, last 2 years)


10158 Points ∼62% +3%

Asus ROG Strix Scar 17 SE G733CX-LL014W
GeForce RTX 3080 Ti Laptop GPU, i9-12950HX, Samsung PM9A1 MZVL22T0HBLB


10003 Points ∼61% +1%

MSI Katana 17 B13VFK
NVIDIA GeForce RTX 4060 Laptop GPU, i7-13620H, Micron 2400 MTFDKBA1T0QFM


9903 Points ∼60%

Average Intel Core i7-13620H, NVIDIA GeForce RTX 4060 Laptop GPU


9903 Points ∼60% 0%

Gigabyte G7 KE
GeForce RTX 3060 Laptop GPU, i5-12500H, Gigabyte AG470S1TB-SI B10


6703 Points ∼41% -32%

CrossMark / Overall
MSI Titan GT77 HX 13VI
NVIDIA GeForce RTX 4090 Laptop GPU, i9-13950HX, Samsung PM9A1 MZVL22T0HBLB


2139 Points ∼100% +15%

Asus ROG Strix Scar 17 SE G733CX-LL014W
GeForce RTX 3080 Ti Laptop GPU, i9-12950HX, Samsung PM9A1 MZVL22T0HBLB


2112 Points ∼99% +14%

Acer Predator Helios 300 (i7-12700H, RTX 3070 Ti)
GeForce RTX 3070 Ti Laptop GPU, i7-12700H, Samsung PM9A1 MZVL21T0HCLR


1879 Points ∼88% +1%

MSI Katana 17 B13VFK
NVIDIA GeForce RTX 4060 Laptop GPU, i7-13620H, Micron 2400 MTFDKBA1T0QFM


1857 Points ∼87%

Average Intel Core i7-13620H, NVIDIA GeForce RTX 4060 Laptop GPU


1857 Points ∼87% 0%

MSI Pulse GL76 12UGK
GeForce RTX 3070 Laptop GPU, i7-12700H, Micron 3400 1TB MTFDKBA1T0TFH


1844 Points ∼86% -1%

Gigabyte G7 KE
GeForce RTX 3060 Laptop GPU, i5-12500H, Gigabyte AG470S1TB-SI B10


1824 Points ∼85% -2%

Average of class Gaming
  (974 – 2170, n=81, last 2 years)


1794 Points ∼84% -3%

CrossMark / Productivity
MSI Titan GT77 HX 13VI
NVIDIA GeForce RTX 4090 Laptop GPU, i9-13950HX, Samsung PM9A1 MZVL22T0HBLB


1977 Points ∼100% +12%

Asus ROG Strix Scar 17 SE G733CX-LL014W
GeForce RTX 3080 Ti Laptop GPU, i9-12950HX, Samsung PM9A1 MZVL22T0HBLB


1966 Points ∼99% +11%

Gigabyte G7 KE
GeForce RTX 3060 Laptop GPU, i5-12500H, Gigabyte AG470S1TB-SI B10


1804 Points ∼91% +2%

MSI Pulse GL76 12UGK
GeForce RTX 3070 Laptop GPU, i7-12700H, Micron 3400 1TB MTFDKBA1T0TFH


1785 Points ∼90% +1%

Acer Predator Helios 300 (i7-12700H, RTX 3070 Ti)
GeForce RTX 3070 Ti Laptop GPU, i7-12700H, Samsung PM9A1 MZVL21T0HCLR


1767 Points ∼89% 0%

MSI Katana 17 B13VFK
NVIDIA GeForce RTX 4060 Laptop GPU, i7-13620H, Micron 2400 MTFDKBA1T0QFM


1765 Points ∼89%

Average Intel Core i7-13620H, NVIDIA GeForce RTX 4060 Laptop GPU


1765 Points ∼89% 0%

Average of class Gaming
  (907 – 2062, n=81, last 2 years)


1729 Points ∼87% -2%

CrossMark / Creativity
MSI Titan GT77 HX 13VI
NVIDIA GeForce RTX 4090 Laptop GPU, i9-13950HX, Samsung PM9A1 MZVL22T0HBLB


2423 Points ∼100% +20%

Asus ROG Strix Scar 17 SE G733CX-LL014W
GeForce RTX 3080 Ti Laptop GPU, i9-12950HX, Samsung PM9A1 MZVL22T0HBLB


2336 Points ∼96% +16%

Acer Predator Helios 300 (i7-12700H, RTX 3070 Ti)
GeForce RTX 3070 Ti Laptop GPU, i7-12700H, Samsung PM9A1 MZVL21T0HCLR


2057 Points ∼85% +2%

MSI Katana 17 B13VFK
NVIDIA GeForce RTX 4060 Laptop GPU, i7-13620H, Micron 2400 MTFDKBA1T0QFM


2013 Points ∼83%

Average Intel Core i7-13620H, NVIDIA GeForce RTX 4060 Laptop GPU


2013 Points ∼83% 0%

MSI Pulse GL76 12UGK
GeForce RTX 3070 Laptop GPU, i7-12700H, Micron 3400 1TB MTFDKBA1T0TFH


1912 Points ∼79% -5%

Average of class Gaming
  (1027 – 2455, n=81, last 2 years)


1910 Points ∼79% -5%

Gigabyte G7 KE
GeForce RTX 3060 Laptop GPU, i5-12500H, Gigabyte AG470S1TB-SI B10


1800 Points ∼74% -11%

CrossMark / Responsiveness
Gigabyte G7 KE
GeForce RTX 3060 Laptop GPU, i5-12500H, Gigabyte AG470S1TB-SI B10


1966 Points ∼100% +13%

Asus ROG Strix Scar 17 SE G733CX-LL014W
GeForce RTX 3080 Ti Laptop GPU, i9-12950HX, Samsung PM9A1 MZVL22T0HBLB


1936 Points ∼98% +12%

MSI Titan GT77 HX 13VI
NVIDIA GeForce RTX 4090 Laptop GPU, i9-13950HX, Samsung PM9A1 MZVL22T0HBLB


1861 Points ∼95% +7%

MSI Pulse GL76 12UGK
GeForce RTX 3070 Laptop GPU, i7-12700H, Micron 3400 1TB MTFDKBA1T0TFH


1824 Points ∼93% +5%

MSI Katana 17 B13VFK
NVIDIA GeForce RTX 4060 Laptop GPU, i7-13620H, Micron 2400 MTFDKBA1T0QFM


1734 Points ∼88%

Average Intel Core i7-13620H, NVIDIA GeForce RTX 4060 Laptop GPU


1734 Points ∼88% 0%

Acer Predator Helios 300 (i7-12700H, RTX 3070 Ti)
GeForce RTX 3070 Ti Laptop GPU, i7-12700H, Samsung PM9A1 MZVL21T0HCLR


1724 Points ∼88% -1%

Average of class Gaming
  (1029 – 2230, n=81, last 2 years)


1676 Points ∼85% -3%

PCMark 10 Score7160 points

Help

AIDA64 / Memory Copy
MSI Titan GT77 HX 13VI
Intel Core i9-13950HX, NVIDIA GeForce RTX 4090 Laptop GPU


63863 MB/s ∼100% +20%

Asus ROG Strix Scar 17 SE G733CX-LL014W
Intel Core i9-12950HX, GeForce RTX 3080 Ti Laptop GPU


63831 MB/s ∼100% +20%

Acer Predator Helios 300 (i7-12700H, RTX 3070 Ti)
Intel Core i7-12700H, GeForce RTX 3070 Ti Laptop GPU


56902 MB/s ∼89% +7%

MSI Katana 17 B13VFK
Intel Core i7-13620H, NVIDIA GeForce RTX 4060 Laptop GPU


53391 MB/s ∼84%

Average Intel Core i7-13620H


53391 MB/s ∼84% 0%

Average of class Gaming
  (18074 – 77803, n=191, last 2 years)


49308 MB/s ∼77% -8%

MSI Pulse GL76 12UGK
Intel Core i7-12700H, GeForce RTX 3070 Laptop GPU


45358 MB/s ∼71% -15%

Gigabyte G7 KE
Intel Core i5-12500H, GeForce RTX 3060 Laptop GPU


44994 MB/s ∼70% -16%

AIDA64 / Memory Read
Asus ROG Strix Scar 17 SE G733CX-LL014W
Intel Core i9-12950HX, GeForce RTX 3080 Ti Laptop GPU


69256 MB/s ∼100% +12%

MSI Titan GT77 HX 13VI
Intel Core i9-13950HX, NVIDIA GeForce RTX 4090 Laptop GPU


62807 MB/s ∼91% +2%

MSI Katana 17 B13VFK
Intel Core i7-13620H, NVIDIA GeForce RTX 4060 Laptop GPU


61613 MB/s ∼89%

Average Intel Core i7-13620H


61613 MB/s ∼89% 0%

Acer Predator Helios 300 (i7-12700H, RTX 3070 Ti)
Intel Core i7-12700H, GeForce RTX 3070 Ti Laptop GPU


59391 MB/s ∼86% -4%

Average of class Gaming
  (20318 – 86207, n=191, last 2 years)


52657 MB/s ∼76% -15%

MSI Pulse GL76 12UGK
Intel Core i7-12700H, GeForce RTX 3070 Laptop GPU


49450 MB/s ∼71% -20%

Gigabyte G7 KE
Intel Core i5-12500H, GeForce RTX 3060 Laptop GPU


47559 MB/s ∼69% -23%

AIDA64 / Memory Write
Asus ROG Strix Scar 17 SE G733CX-LL014W
Intel Core i9-12950HX, GeForce RTX 3080 Ti Laptop GPU


65800 MB/s ∼100% +30%

MSI Titan GT77 HX 13VI
Intel Core i9-13950HX, NVIDIA GeForce RTX 4090 Laptop GPU


60389 MB/s ∼92% +19%

Acer Predator Helios 300 (i7-12700H, RTX 3070 Ti)
Intel Core i7-12700H, GeForce RTX 3070 Ti Laptop GPU


56791 MB/s ∼86% +12%

MSI Katana 17 B13VFK
Intel Core i7-13620H, NVIDIA GeForce RTX 4060 Laptop GPU


50700 MB/s ∼77%

Average Intel Core i7-13620H


50700 MB/s ∼77% 0%

Average of class Gaming
  (15975 – 80441, n=191, last 2 years)


50483 MB/s ∼77% 0%

Gigabyte G7 KE
Intel Core i5-12500H, GeForce RTX 3060 Laptop GPU


46966 MB/s ∼71% -7%

MSI Pulse GL76 12UGK
Intel Core i7-12700H, GeForce RTX 3070 Laptop GPU


46603 MB/s ∼71% -8%

AIDA64 / Memory Latency
MSI Katana 17 B13VFK
Intel Core i7-13620H, NVIDIA GeForce RTX 4060 Laptop GPU


101.7 ns * ∼100%

Average Intel Core i7-13620H


101.7 ns * ∼100% -0%

MSI Pulse GL76 12UGK
Intel Core i7-12700H, GeForce RTX 3070 Laptop GPU


93.7 ns * ∼92% +8%

MSI Titan GT77 HX 13VI
Intel Core i9-13950HX, NVIDIA GeForce RTX 4090 Laptop GPU


92.8 ns * ∼91% +9%

Acer Predator Helios 300 (i7-12700H, RTX 3070 Ti)
Intel Core i7-12700H, GeForce RTX 3070 Ti Laptop GPU


91.3 ns * ∼90% +10%

Gigabyte G7 KE
Intel Core i5-12500H, GeForce RTX 3060 Laptop GPU


89.8 ns * ∼88% +12%

Asus ROG Strix Scar 17 SE G733CX-LL014W
Intel Core i9-12950HX, GeForce RTX 3080 Ti Laptop GPU


85.2 ns * ∼84% +16%

Average of class Gaming
  (76.2 – 135.3, n=212, last 2 years)


67.9 ns * ∼67% +33%

* … smaller is better

DPC Latencies / LatencyMon – interrupt to process latency (max), Web, Youtube, Prime95
MSI Titan GT77 HX 13VI
NVIDIA GeForce RTX 4090 Laptop GPU, i9-13950HX, Samsung PM9A1 MZVL22T0HBLB


4710.9 μs * ∼100% -97%

Asus ROG Strix Scar 17 SE G733CX-LL014W
GeForce RTX 3080 Ti Laptop GPU, i9-12950HX, Samsung PM9A1 MZVL22T0HBLB


3413 μs * ∼72% -42%

MSI Katana 17 B13VFK
NVIDIA GeForce RTX 4060 Laptop GPU, i7-13620H, Micron 2400 MTFDKBA1T0QFM


2396.6 μs * ∼51%

Gigabyte G7 KE
GeForce RTX 3060 Laptop GPU, i5-12500H, Gigabyte AG470S1TB-SI B10


1969.3 μs * ∼42% +18%

Acer Predator Helios 300 (i7-12700H, RTX 3070 Ti)
GeForce RTX 3070 Ti Laptop GPU, i7-12700H, Samsung PM9A1 MZVL21T0HCLR


1527.7 μs * ∼32% +36%

MSI Pulse GL76 12UGK
GeForce RTX 3070 Laptop GPU, i7-12700H, Micron 3400 1TB MTFDKBA1T0TFH


950 μs * ∼20% +60%

* … smaller is better

With a capacity of one terabyte, the Micron 2400 is, in itself, a fast NVMe PCIe 4.0 SSD, performance-wise, it cannot keep up with the competition. However, this shouldn’t really be noticeable in everday use.

Sequential Read:
3920MB/s

Sequential Write:
3007MB/s

Access Time Read:
0.094ms

Access Time Write:
0.096ms

Drive Performance Rating – Percent
Asus ROG Strix Scar 17 SE G733CX-LL014W
Samsung PM9A1 MZVL22T0HBLB


81.3 pt ∼81%

Gigabyte G7 KE
Gigabyte AG470S1TB-SI B10


76.3 pt ∼76%

Acer Predator Helios 300 (i7-12700H, RTX 3070 Ti)
Samsung PM9A1 MZVL21T0HCLR


72 pt ∼72%

MSI Titan GT77 HX 13VI
Samsung PM9A1 MZVL22T0HBLB


68.3 pt ∼68%

MSI Pulse GL76 12UGK
Micron 3400 1TB MTFDKBA1T0TFH


67.2 pt ∼67%

Average of class Gaming


55.4 pt ∼55%

MSI Katana 17 B13VFK
Micron 2400 MTFDKBA1T0QFM


52.6 pt ∼53%

Average Micron 2400 MTFDKBA1T0QFM


50.2 pt ∼50%

DiskSpd
seq read
MSI Titan GT77 HX 13VI
Samsung PM9A1 MZVL22T0HBLB


5598 (5462.22min – 5597.85max) MB/s ∼100% +117%

Asus ROG Strix Scar 17 SE G733CX-LL014W
Samsung PM9A1 MZVL22T0HBLB


5568 (5541.55min – 5568.34max) MB/s ∼99% +116%

Acer Predator Helios 300 (i7-12700H, RTX 3070 Ti)
Samsung PM9A1 MZVL21T0HCLR


4272 (1951.61min – 4271.9max) MB/s ∼76% +66%

MSI Pulse GL76 12UGK
Micron 3400 1TB MTFDKBA1T0TFH


3889 (3772.15min – 3889.15max) MB/s ∼69% +51%

Gigabyte G7 KE
Gigabyte AG470S1TB-SI B10


3101 (2775.37min – 3100.52max) MB/s ∼55% +20%

Average of class Gaming
  (834 – 5598, n=174, last 2 years)


3030 MB/s ∼54% +18%

MSI Katana 17 B13VFK
Micron 2400 MTFDKBA1T0QFM


2578 (2552.79min – 2578.03max) MB/s ∼46%

Average Micron 2400 MTFDKBA1T0QFM
  (2460 – 2578, n=2)


2519 MB/s ∼45% -2%

seq write
MSI Titan GT77 HX 13VI
Samsung PM9A1 MZVL22T0HBLB


7533 (7482.85min – 7532.79max) MB/s ∼100% +142%

Asus ROG Strix Scar 17 SE G733CX-LL014W
Samsung PM9A1 MZVL22T0HBLB


7531 (7479min – 7530.7max) MB/s ∼100% +142%

MSI Pulse GL76 12UGK
Micron 3400 1TB MTFDKBA1T0TFH


4579 (4190.54min – 4578.92max) MB/s ∼61% +47%

Acer Predator Helios 300 (i7-12700H, RTX 3070 Ti)
Samsung PM9A1 MZVL21T0HCLR


4394 (4343.95min – 4393.95max) MB/s ∼58% +41%

Average of class Gaming
  (399 – 7889, n=173, last 2 years)


3233 MB/s ∼43% +4%

MSI Katana 17 B13VFK
Micron 2400 MTFDKBA1T0QFM


3115 (2904.62min – 3115.38max) MB/s ∼41%

Average Micron 2400 MTFDKBA1T0QFM
  (2991 – 3115, n=2)


3053 MB/s ∼41% -2%

Gigabyte G7 KE
Gigabyte AG470S1TB-SI B10


2749 (2612.84min – 2749.11max) MB/s ∼36% -12%

seq q8 t1 read
Asus ROG Strix Scar 17 SE G733CX-LL014W
Samsung PM9A1 MZVL22T0HBLB


12556 (4870.54min – 12556.3max) MB/s ∼100% +166%

MSI Titan GT77 HX 13VI
Samsung PM9A1 MZVL22T0HBLB


11242 (10740.3min – 11242.2max) MB/s ∼90% +138%

Gigabyte G7 KE
Gigabyte AG470S1TB-SI B10


7032 (6100.58min – 7031.96max) MB/s ∼56% +49%

MSI Pulse GL76 12UGK
Micron 3400 1TB MTFDKBA1T0TFH


6697 (5704.17min – 6696.63max) MB/s ∼53% +42%

Acer Predator Helios 300 (i7-12700H, RTX 3070 Ti)
Samsung PM9A1 MZVL21T0HCLR


6319 (1848.3min – 6318.66max) MB/s ∼50% +34%

Average of class Gaming
  (1620 – 13195, n=174, last 2 years)


5210 MB/s ∼41% +10%

MSI Katana 17 B13VFK
Micron 2400 MTFDKBA1T0QFM


4719 (4052.12min – 4719.01max) MB/s ∼38%

Average Micron 2400 MTFDKBA1T0QFM
  (4633 – 4719, n=2)


4676 MB/s ∼37% -1%

seq q8 t1 write
Asus ROG Strix Scar 17 SE G733CX-LL014W
Samsung PM9A1 MZVL22T0HBLB


10261 (10045.2min – 10261.4max) MB/s ∼100% +183%

MSI Titan GT77 HX 13VI
Samsung PM9A1 MZVL22T0HBLB


9942 (9912.92min – 9941.76max) MB/s ∼97% +174%

Acer Predator Helios 300 (i7-12700H, RTX 3070 Ti)
Samsung PM9A1 MZVL21T0HCLR


5259 (5245.4min – 5258.61max) MB/s ∼51% +45%

MSI Pulse GL76 12UGK
Micron 3400 1TB MTFDKBA1T0TFH


4956 (4523.11min – 4956.35max) MB/s ∼48% +37%

Average of class Gaming
  (86.2 – 10261, n=174, last 2 years)


3925 MB/s ∼38% +8%

MSI Katana 17 B13VFK
Micron 2400 MTFDKBA1T0QFM


3629 (3402.12min – 3628.58max) MB/s ∼35%

Gigabyte G7 KE
Gigabyte AG470S1TB-SI B10


3613 (3580.5min – 3612.97max) MB/s ∼35% 0%

Average Micron 2400 MTFDKBA1T0QFM
  (3415 – 3629, n=2)


3522 MB/s ∼34% -3%

4k q1 t1 read
Acer Predator Helios 300 (i7-12700H, RTX 3070 Ti)
Samsung PM9A1 MZVL21T0HCLR


86.5 (85.74min – 86.52max) MB/s ∼100% +129%

MSI Titan GT77 HX 13VI
Samsung PM9A1 MZVL22T0HBLB


83.1 (79.37min – 83.07max) MB/s ∼96% +120%

Asus ROG Strix Scar 17 SE G733CX-LL014W
Samsung PM9A1 MZVL22T0HBLB


79 (77.42min – 79.03max) MB/s ∼91% +110%

Gigabyte G7 KE
Gigabyte AG470S1TB-SI B10


76.7 (73.36min – 76.74max) MB/s ∼89% +103%

MSI Pulse GL76 12UGK
Micron 3400 1TB MTFDKBA1T0TFH


69.8 (68.67min – 69.84max) MB/s ∼81% +85%

Average of class Gaming
  (23.3 – 97.4, n=174, last 2 years)


64.6 MB/s ∼75% +71%

MSI Katana 17 B13VFK
Micron 2400 MTFDKBA1T0QFM


37.7 (37.23min – 37.65max) MB/s ∼44%

Average Micron 2400 MTFDKBA1T0QFM
  (35.5 – 37.7, n=2)


36.6 MB/s ∼42% -3%

4k q1 t1 write
Gigabyte G7 KE
Gigabyte AG470S1TB-SI B10


391 (373.18min – 391.21max) MB/s ∼100% +37%

MSI Katana 17 B13VFK
Micron 2400 MTFDKBA1T0QFM


286 (269.48min – 285.84max) MB/s ∼73%

MSI Pulse GL76 12UGK
Micron 3400 1TB MTFDKBA1T0TFH


263 (255.65min – 263.15max) MB/s ∼67% -8%

Average Micron 2400 MTFDKBA1T0QFM
  (181.3 – 286, n=2)


234 MB/s ∼60% -18%

Asus ROG Strix Scar 17 SE G733CX-LL014W
Samsung PM9A1 MZVL22T0HBLB


221 (218.91min – 220.66max) MB/s ∼57% -23%

Acer Predator Helios 300 (i7-12700H, RTX 3070 Ti)
Samsung PM9A1 MZVL21T0HCLR


213 (195.99min – 212.69max) MB/s ∼54% -26%

MSI Titan GT77 HX 13VI
Samsung PM9A1 MZVL22T0HBLB


213 (205.52min – 212.72max) MB/s ∼54% -26%

Average of class Gaming
  (66.6 – 421, n=173, last 2 years)


201 MB/s ∼51% -30%

4k q32 t16 read
Gigabyte G7 KE
Gigabyte AG470S1TB-SI B10


3551 (3544.16min – 3551.38max) MB/s ∼100% +28%

Acer Predator Helios 300 (i7-12700H, RTX 3070 Ti)
Samsung PM9A1 MZVL21T0HCLR


3222 (3204.74min – 3221.65max) MB/s ∼91% +16%

MSI Pulse GL76 12UGK
Micron 3400 1TB MTFDKBA1T0TFH


2861 (2814.76min – 2861.3max) MB/s ∼81% +3%

MSI Katana 17 B13VFK
Micron 2400 MTFDKBA1T0QFM


2769 MB/s ∼78%

Average Micron 2400 MTFDKBA1T0QFM
  (2025 – 2769, n=2)


2397 MB/s ∼68% -13%

Average of class Gaming
  (310 – 4483, n=173, last 2 years)


2304 MB/s ∼65% -17%

Asus ROG Strix Scar 17 SE G733CX-LL014W
Samsung PM9A1 MZVL22T0HBLB


2148 (1952.04min – 2148.3max) MB/s ∼60% -22%

MSI Titan GT77 HX 13VI
Samsung PM9A1 MZVL22T0HBLB


1469 (1266.81min – 1469.47max) MB/s ∼41% -47%

4k q32 t16 write
Gigabyte G7 KE
Gigabyte AG470S1TB-SI B10


3576 (3480.8min – 3575.55max) MB/s ∼100% +36%

MSI Pulse GL76 12UGK
Micron 3400 1TB MTFDKBA1T0TFH


2700 (2613.77min – 2699.68max) MB/s ∼76% +2%

MSI Katana 17 B13VFK
Micron 2400 MTFDKBA1T0QFM


2635 (2459.5min – 2634.95max) MB/s ∼74%

Acer Predator Helios 300 (i7-12700H, RTX 3070 Ti)
Samsung PM9A1 MZVL21T0HCLR


2623 (2563.77min – 2622.75max) MB/s ∼73% 0%

Average Micron 2400 MTFDKBA1T0QFM
  (2291 – 2635, n=2)


2463 MB/s ∼69% -7%

Asus ROG Strix Scar 17 SE G733CX-LL014W
Samsung PM9A1 MZVL22T0HBLB


2101 (1969.73min – 2101.4max) MB/s ∼59% -20%

Average of class Gaming
  (288 – 4383, n=173, last 2 years)


2035 MB/s ∼57% -23%

MSI Titan GT77 HX 13VI
Samsung PM9A1 MZVL22T0HBLB


1424 (1251.47min – 1423.75max) MB/s ∼40% -46%

AS SSD
Score Total
Gigabyte G7 KE
Gigabyte AG470S1TB-SI B10


8837 Points ∼100% +40%

Asus ROG Strix Scar 17 SE G733CX-LL014W
Samsung PM9A1 MZVL22T0HBLB


7498 Points ∼85% +19%

MSI Pulse GL76 12UGK
Micron 3400 1TB MTFDKBA1T0TFH


7307 Points ∼83% +16%

Acer Predator Helios 300 (i7-12700H, RTX 3070 Ti)
Samsung PM9A1 MZVL21T0HCLR


7306 Points ∼83% +16%

MSI Katana 17 B13VFK
Micron 2400 MTFDKBA1T0QFM


6311 Points ∼71%

Average of class Gaming
  (910 – 9510, n=165, last 2 years)


6189 Points ∼70% -2%

Average Micron 2400 MTFDKBA1T0QFM
  (5903 – 6311, n=2)


6107 Points ∼69% -3%

MSI Titan GT77 HX 13VI
Samsung PM9A1 MZVL22T0HBLB


4850 Points ∼55% -23%

Score Read
Gigabyte G7 KE
Gigabyte AG470S1TB-SI B10


3468 Points ∼100% +42%

Asus ROG Strix Scar 17 SE G733CX-LL014W
Samsung PM9A1 MZVL22T0HBLB


3012 Points ∼87% +23%

Acer Predator Helios 300 (i7-12700H, RTX 3070 Ti)
Samsung PM9A1 MZVL21T0HCLR


2837 Points ∼82% +16%

MSI Pulse GL76 12UGK
Micron 3400 1TB MTFDKBA1T0TFH


2792 Points ∼81% +14%

MSI Katana 17 B13VFK
Micron 2400 MTFDKBA1T0QFM


2446 Points ∼71%

Average Micron 2400 MTFDKBA1T0QFM
  (2348 – 2446, n=2)


2397 Points ∼69% -2%

Average of class Gaming
  (389 – 3629, n=165, last 2 years)


2329 Points ∼67% -5%

MSI Titan GT77 HX 13VI
Samsung PM9A1 MZVL22T0HBLB


2035 Points ∼59% -17%

Score Write
Gigabyte G7 KE
Gigabyte AG470S1TB-SI B10


3621 Points ∼100% +36%

MSI Pulse GL76 12UGK
Micron 3400 1TB MTFDKBA1T0TFH


3117 Points ∼86% +17%

Asus ROG Strix Scar 17 SE G733CX-LL014W
Samsung PM9A1 MZVL22T0HBLB


3013 Points ∼83% +13%

Acer Predator Helios 300 (i7-12700H, RTX 3070 Ti)
Samsung PM9A1 MZVL21T0HCLR


2964 Points ∼82% +12%

Average of class Gaming
  (338 – 4522, n=165, last 2 years)


2708 Points ∼75% +2%

MSI Katana 17 B13VFK
Micron 2400 MTFDKBA1T0QFM


2658 Points ∼73%

Average Micron 2400 MTFDKBA1T0QFM
  (2404 – 2658, n=2)


2531 Points ∼70% -5%

MSI Titan GT77 HX 13VI
Samsung PM9A1 MZVL22T0HBLB


1877 Points ∼52% -29%

Seq Read
Asus ROG Strix Scar 17 SE G733CX-LL014W
Samsung PM9A1 MZVL22T0HBLB


9971 MB/s ∼100% +154%

MSI Titan GT77 HX 13VI
Samsung PM9A1 MZVL22T0HBLB


9511 MB/s ∼95% +143%

MSI Pulse GL76 12UGK
Micron 3400 1TB MTFDKBA1T0TFH


4843.81 MB/s ∼49% +24%

Gigabyte G7 KE
Gigabyte AG470S1TB-SI B10


4540.75 MB/s ∼46% +16%

Average of class Gaming
  (925 – 9971, n=165, last 2 years)


4143 MB/s ∼42% +6%

Average Micron 2400 MTFDKBA1T0QFM
  (3920 – 3977, n=2)


3948 MB/s ∼40% +1%

MSI Katana 17 B13VFK
Micron 2400 MTFDKBA1T0QFM


3920 MB/s ∼39%

Acer Predator Helios 300 (i7-12700H, RTX 3070 Ti)
Samsung PM9A1 MZVL21T0HCLR


3431 MB/s ∼34% -12%

Seq Write
Asus ROG Strix Scar 17 SE G733CX-LL014W
Samsung PM9A1 MZVL22T0HBLB


8590 MB/s ∼100% +186%

MSI Titan GT77 HX 13VI
Samsung PM9A1 MZVL22T0HBLB


7181 MB/s ∼84% +139%

Acer Predator Helios 300 (i7-12700H, RTX 3070 Ti)
Samsung PM9A1 MZVL21T0HCLR


4370 MB/s ∼51% +45%

MSI Pulse GL76 12UGK
Micron 3400 1TB MTFDKBA1T0TFH


4200.32 MB/s ∼49% +40%

Gigabyte G7 KE
Gigabyte AG470S1TB-SI B10


3805.55 MB/s ∼44% +27%

Average of class Gaming
  (308 – 8590, n=165, last 2 years)


3018 MB/s ∼35% 0%

Average Micron 2400 MTFDKBA1T0QFM
  (3007 – 3021, n=2)


3014 MB/s ∼35% 0%

MSI Katana 17 B13VFK
Micron 2400 MTFDKBA1T0QFM


3007 MB/s ∼35%

4K Read
Gigabyte G7 KE
Gigabyte AG470S1TB-SI B10


99.79 MB/s ∼100% +70%

Acer Predator Helios 300 (i7-12700H, RTX 3070 Ti)
Samsung PM9A1 MZVL21T0HCLR


80.14 MB/s ∼80% +36%

MSI Titan GT77 HX 13VI
Samsung PM9A1 MZVL22T0HBLB


72.8 MB/s ∼73% +24%

Asus ROG Strix Scar 17 SE G733CX-LL014W
Samsung PM9A1 MZVL22T0HBLB


72.43 MB/s ∼73% +23%

MSI Pulse GL76 12UGK
Micron 3400 1TB MTFDKBA1T0TFH


67.56 MB/s ∼68% +15%

Average of class Gaming
  (20 – 108, n=165, last 2 years)


62.6 MB/s ∼63% +6%

MSI Katana 17 B13VFK
Micron 2400 MTFDKBA1T0QFM


58.8 MB/s ∼59%

Average Micron 2400 MTFDKBA1T0QFM
  (49.3 – 58.8, n=2)


54 MB/s ∼54% -8%

4K Write
Gigabyte G7 KE
Gigabyte AG470S1TB-SI B10


325.41 MB/s ∼100% +31%

MSI Katana 17 B13VFK
Micron 2400 MTFDKBA1T0QFM


249 MB/s ∼77%

MSI Pulse GL76 12UGK
Micron 3400 1TB MTFDKBA1T0TFH


213.7 MB/s ∼66% -14%

Asus ROG Strix Scar 17 SE G733CX-LL014W
Samsung PM9A1 MZVL22T0HBLB


204.33 MB/s ∼63% -18%

Average Micron 2400 MTFDKBA1T0QFM
  (152.8 – 249, n=2)


201 MB/s ∼62% -19%

Acer Predator Helios 300 (i7-12700H, RTX 3070 Ti)
Samsung PM9A1 MZVL21T0HCLR


196.06 MB/s ∼60% -21%

Average of class Gaming
  (18 – 364, n=165, last 2 years)


179.2 MB/s ∼55% -28%

MSI Titan GT77 HX 13VI
Samsung PM9A1 MZVL22T0HBLB


177.9 MB/s ∼55% -29%

4K-64 Read
Gigabyte G7 KE
Gigabyte AG470S1TB-SI B10


2914.54 MB/s ∼100% +46%

Acer Predator Helios 300 (i7-12700H, RTX 3070 Ti)
Samsung PM9A1 MZVL21T0HCLR


2413.38 MB/s ∼83% +21%

MSI Pulse GL76 12UGK
Micron 3400 1TB MTFDKBA1T0TFH


2240.41 MB/s ∼77% +12%

MSI Katana 17 B13VFK
Micron 2400 MTFDKBA1T0QFM


1995 MB/s ∼68%

Average Micron 2400 MTFDKBA1T0QFM
  (1901 – 1995, n=2)


1948 MB/s ∼67% -2%

Asus ROG Strix Scar 17 SE G733CX-LL014W
Samsung PM9A1 MZVL22T0HBLB


1942.29 MB/s ∼67% -3%

Average of class Gaming
  (216 – 2963, n=165, last 2 years)


1852 MB/s ∼64% -7%

MSI Titan GT77 HX 13VI
Samsung PM9A1 MZVL22T0HBLB


1011 MB/s ∼35% -49%

4K-64 Write
Gigabyte G7 KE
Gigabyte AG470S1TB-SI B10


2915.33 MB/s ∼100% +38%

MSI Pulse GL76 12UGK
Micron 3400 1TB MTFDKBA1T0TFH


2483.08 MB/s ∼85% +18%

Acer Predator Helios 300 (i7-12700H, RTX 3070 Ti)
Samsung PM9A1 MZVL21T0HCLR


2331.1 MB/s ∼80% +11%

Average of class Gaming
  (243 – 4008, n=165, last 2 years)


2239 MB/s ∼77% +6%

MSI Katana 17 B13VFK
Micron 2400 MTFDKBA1T0QFM


2108 MB/s ∼72%

Average Micron 2400 MTFDKBA1T0QFM
  (1949 – 2108, n=2)


2029 MB/s ∼70% -4%

Asus ROG Strix Scar 17 SE G733CX-LL014W
Samsung PM9A1 MZVL22T0HBLB


1949.41 MB/s ∼67% -8%

MSI Titan GT77 HX 13VI
Samsung PM9A1 MZVL22T0HBLB


981 MB/s ∼34% -53%

Access Time Read
Gigabyte G7 KE
Gigabyte AG470S1TB-SI B10


0.094 ms * ∼100% -0%

MSI Katana 17 B13VFK
Micron 2400 MTFDKBA1T0QFM


0.094 ms * ∼100%

Average Micron 2400 MTFDKBA1T0QFM
  (0.05 – 0.094, n=2)


0.072 ms * ∼77% +23%

Average of class Gaming
  (0.022 – 0.23, n=160, last 2 years)


0.05687 ms * ∼61% +39%

MSI Pulse GL76 12UGK
Micron 3400 1TB MTFDKBA1T0TFH


0.038 ms * ∼40% +60%

MSI Titan GT77 HX 13VI
Samsung PM9A1 MZVL22T0HBLB


0.036 ms * ∼38% +62%

Asus ROG Strix Scar 17 SE G733CX-LL014W
Samsung PM9A1 MZVL22T0HBLB


0.022 ms * ∼23% +77%

Acer Predator Helios 300 (i7-12700H, RTX 3070 Ti)
Samsung PM9A1 MZVL21T0HCLR


0 ms * ∼0% +100%

Access Time Write
Average Micron 2400 MTFDKBA1T0QFM
  (0.096 – 0.105, n=2)


0.1005 ms * ∼100% -5%

MSI Katana 17 B13VFK
Micron 2400 MTFDKBA1T0QFM


0.096 ms * ∼96%

MSI Pulse GL76 12UGK
Micron 3400 1TB MTFDKBA1T0TFH


0.061 ms * ∼61% +36%

Average of class Gaming
  (0.012 – 0.425, n=165, last 2 years)


0.05809 ms * ∼58% +39%

Asus ROG Strix Scar 17 SE G733CX-LL014W
Samsung PM9A1 MZVL22T0HBLB


0.023 ms * ∼23% +76%

MSI Titan GT77 HX 13VI
Samsung PM9A1 MZVL22T0HBLB


0.023 ms * ∼23% +76%

Acer Predator Helios 300 (i7-12700H, RTX 3070 Ti)
Samsung PM9A1 MZVL21T0HCLR


0.022 ms * ∼22% +77%

Gigabyte G7 KE
Gigabyte AG470S1TB-SI B10


0.012 ms * ∼12% +87%

* … smaller is better

0240480720960120014401680192021602400264028803120336036003840408043204560Tooltip
GPU-Z Nvidia GeForce RTX 4060

The Nvidia GeForce RTX 4060 is a mid-range GPU from Nvidia’s “Ada Lovelace” generation. The 3072 shader units are clocked at a maximum of 2.25 GHz and the GPU installed here has eight gigabytes of GDDR6 RAM at its disposal. You can find additional comparisons with other graphics chips in our GPU benchmark list.

In 3DMark tests, the new GPU has its nose in front of last generation’s Nvidia GeForce RTX 3070 – but only just. By contrast, the RTX 3070 Ti is marginally faster. Compared to the Nvidia GeForce RTX 3060, the RTX 4060 – which can consume its maximum 105 watts here – is around 23 % faster. At 115 watts, the Gigabyte G7 KE found in the 3060 consumed a little more than the 4060. The RTX 4060 is clearly outclassed by the GeForce RTX 4090 and was to be expected. In 3DMark benchmarks, the high-end chip runs twice as fast. The Blender benchmark results confirm the 3DMark test results.

As with the processor, the graphics card has a performance limit in battery mode. Without a power supply unit, only 50 % of GPU performance is available.

3DMark Performance Rating – Percent
MSI Titan GT77 HX 13VI
NVIDIA GeForce RTX 4090 Laptop GPU, Intel Core i9-13950HX


100 pt ∼100%

Asus ROG Strix Scar 17 SE G733CX-LL014W
NVIDIA GeForce RTX 3080 Ti Laptop GPU, Intel Core i9-12950HX


62.4 pt ∼62%

Acer Predator Helios 300 (i7-12700H, RTX 3070 Ti)
NVIDIA GeForce RTX 3070 Ti Laptop GPU, Intel Core i7-12700H


54.7 pt ∼55%

MSI Katana 17 B13VFK
NVIDIA GeForce RTX 4060 Laptop GPU, Intel Core i7-13620H


51.7 pt ∼52%

Average NVIDIA GeForce RTX 4060 Laptop GPU


51.7 pt ∼52%

Average of class Gaming


47.7 pt ∼48%

MSI Pulse GL76 12UGK
NVIDIA GeForce RTX 3070 Laptop GPU, Intel Core i7-12700H


47.4 pt ∼47%

Gigabyte G7 KE
NVIDIA GeForce RTX 3060 Laptop GPU, Intel Core i5-12500H


42.1 pt ∼42%

3DMark 11 – 1280×720 Performance GPU
MSI Titan GT77 HX 13VI
NVIDIA GeForce RTX 4090 Laptop GPU, Intel Core i9-13950HX


69211 Points ∼100% +91%

Asus ROG Strix Scar 17 SE G733CX-LL014W
NVIDIA GeForce RTX 3080 Ti Laptop GPU, Intel Core i9-12950HX


44134 Points ∼64% +22%

Acer Predator Helios 300 (i7-12700H, RTX 3070 Ti)
NVIDIA GeForce RTX 3070 Ti Laptop GPU, Intel Core i7-12700H


38883 Points ∼56% +7%

MSI Katana 17 B13VFK
NVIDIA GeForce RTX 4060 Laptop GPU, Intel Core i7-13620H


36323 Points ∼52%

Average NVIDIA GeForce RTX 4060 Laptop GPU


36323 Points ∼52% 0%

Average of class Gaming
  (1925 – 69211, n=210, last 2 years)


33328 Points ∼48% -8%

MSI Pulse GL76 12UGK
NVIDIA GeForce RTX 3070 Laptop GPU, Intel Core i7-12700H


33048 Points ∼48% -9%

Gigabyte G7 KE
NVIDIA GeForce RTX 3060 Laptop GPU, Intel Core i5-12500H


28934 Points ∼42% -20%

3DMark
1920×1080 Fire Strike Graphics
MSI Titan GT77 HX 13VI
NVIDIA GeForce RTX 4090 Laptop GPU, Intel Core i9-13950HX


49247 Points ∼100% +78%

Asus ROG Strix Scar 17 SE G733CX-LL014W
NVIDIA GeForce RTX 3080 Ti Laptop GPU, Intel Core i9-12950HX


32505 Points ∼66% +17%

Acer Predator Helios 300 (i7-12700H, RTX 3070 Ti)
NVIDIA GeForce RTX 3070 Ti Laptop GPU, Intel Core i7-12700H


28088 Points ∼57% +1%

MSI Katana 17 B13VFK
NVIDIA GeForce RTX 4060 Laptop GPU, Intel Core i7-13620H


27681 Points ∼56%

Average NVIDIA GeForce RTX 4060 Laptop GPU


27681 Points ∼56% 0%

MSI Pulse GL76 12UGK
NVIDIA GeForce RTX 3070 Laptop GPU, Intel Core i7-12700H


25419 Points ∼52% -8%

Average of class Gaming
  (1360 – 49247, n=220, last 2 years)


25107 Points ∼51% -9%

Gigabyte G7 KE
NVIDIA GeForce RTX 3060 Laptop GPU, Intel Core i5-12500H


22522 Points ∼46% -19%

2560×1440 Time Spy Graphics
MSI Titan GT77 HX 13VI
NVIDIA GeForce RTX 4090 Laptop GPU, Intel Core i9-13950HX


22254 Points ∼100% +116%

Asus ROG Strix Scar 17 SE G733CX-LL014W
NVIDIA GeForce RTX 3080 Ti Laptop GPU, Intel Core i9-12950HX


12791 Points ∼57% +24%

Acer Predator Helios 300 (i7-12700H, RTX 3070 Ti)
NVIDIA GeForce RTX 3070 Ti Laptop GPU, Intel Core i7-12700H


11316 Points ∼51% +10%

MSI Katana 17 B13VFK
NVIDIA GeForce RTX 4060 Laptop GPU, Intel Core i7-13620H


10299 Points ∼46%

Average NVIDIA GeForce RTX 4060 Laptop GPU


10299 Points ∼46% 0%

Average of class Gaming
  (429 – 22254, n=221, last 2 years)


9752 Points ∼44% -5%

MSI Pulse GL76 12UGK
NVIDIA GeForce RTX 3070 Laptop GPU, Intel Core i7-12700H


9548 Points ∼43% -7%

Gigabyte G7 KE
NVIDIA GeForce RTX 3060 Laptop GPU, Intel Core i5-12500H


8597 Points ∼39% -17%

3DMark 06 Standard Score50607 points
3DMark Vantage P Result90275 points
3DMark 11 Performance30831 points
3DMark Ice Storm Standard Score185655 points
3DMark Cloud Gate Standard Score59494 points
3DMark Fire Strike Score22497 points
3DMark Time Spy Score10345 points

Help

Blender
v3.3 Classroom OPTIX/RTX
Gigabyte G7 KE
NVIDIA GeForce RTX 3060 Laptop GPU, Intel Core i5-12500H


33 Seconds * ∼100% -32%

Average of class Gaming
  (10 – 142, n=50, last 2 years)


28.5 Seconds * ∼86% -14%

MSI Pulse GL76 12UGK
NVIDIA GeForce RTX 3070 Laptop GPU, Intel Core i7-12700H


26 Seconds * ∼79% -4%

MSI Katana 17 B13VFK
NVIDIA GeForce RTX 4060 Laptop GPU, Intel Core i7-13620H


25 Seconds * ∼76%

Average NVIDIA GeForce RTX 4060 Laptop GPU


25 Seconds * ∼76% -0%

Acer Predator Helios 300 (i7-12700H, RTX 3070 Ti)
NVIDIA GeForce RTX 3070 Ti Laptop GPU, Intel Core i7-12700H


24 Seconds * ∼73% +4%

Asus ROG Strix Scar 17 SE G733CX-LL014W
NVIDIA GeForce RTX 3080 Ti Laptop GPU, Intel Core i9-12950HX


23 Seconds * ∼70% +8%

MSI Titan GT77 HX 13VI
NVIDIA GeForce RTX 4090 Laptop GPU, Intel Core i9-13950HX


11 Seconds * ∼33% +56%

v3.3 Classroom CUDA
Gigabyte G7 KE
NVIDIA GeForce RTX 3060 Laptop GPU, Intel Core i5-12500H


53 Seconds * ∼100% -20%

Average of class Gaming
  (17 – 168, n=52, last 2 years)


47 Seconds * ∼89% -7%

MSI Pulse GL76 12UGK
NVIDIA GeForce RTX 3070 Laptop GPU, Intel Core i7-12700H


45 Seconds * ∼85% -2%

MSI Katana 17 B13VFK
NVIDIA GeForce RTX 4060 Laptop GPU, Intel Core i7-13620H


44 Seconds * ∼83%

Average NVIDIA GeForce RTX 4060 Laptop GPU


44 Seconds * ∼83% -0%

Acer Predator Helios 300 (i7-12700H, RTX 3070 Ti)
NVIDIA GeForce RTX 3070 Ti Laptop GPU, Intel Core i7-12700H


40 Seconds * ∼75% +9%

Asus ROG Strix Scar 17 SE G733CX-LL014W
NVIDIA GeForce RTX 3080 Ti Laptop GPU, Intel Core i9-12950HX


34 Seconds * ∼64% +23%

MSI Titan GT77 HX 13VI
NVIDIA GeForce RTX 4090 Laptop GPU, Intel Core i9-13950HX


17 Seconds * ∼32% +61%

v3.3 Classroom CPU
Gigabyte G7 KE
NVIDIA GeForce RTX 3060 Laptop GPU, Intel Core i5-12500H


399 Seconds * ∼100% -13%

Acer Predator Helios 300 (i7-12700H, RTX 3070 Ti)
NVIDIA GeForce RTX 3070 Ti Laptop GPU, Intel Core i7-12700H


379 Seconds * ∼95% -7%

Average of class Gaming
  (175 – 698, n=61, last 2 years)


355 Seconds * ∼89% -1%

MSI Katana 17 B13VFK
NVIDIA GeForce RTX 4060 Laptop GPU, Intel Core i7-13620H


353 Seconds * ∼88%

Average NVIDIA GeForce RTX 4060 Laptop GPU


353 Seconds * ∼88% -0%

MSI Pulse GL76 12UGK
NVIDIA GeForce RTX 3070 Laptop GPU, Intel Core i7-12700H


329 Seconds * ∼82% +7%

Asus ROG Strix Scar 17 SE G733CX-LL014W
NVIDIA GeForce RTX 3080 Ti Laptop GPU, Intel Core i9-12950HX


301 Seconds * ∼75% +15%

MSI Titan GT77 HX 13VI
NVIDIA GeForce RTX 4090 Laptop GPU, Intel Core i9-13950HX


175 Seconds * ∼44% +50%

* … smaller is better

In gaming tests, the Nvidia GeForce RTX 4060 does better than in synthetic benchmarks. In this respect, it marginally beats the GeForce RTX 3070 Ti. However, just like the RTX 4090, the RTX 3080 Ti remains unbeatable. Nevertheless, when it comes to gaming, the difference to the flagship isn’t that big with the 4090 still being around 33 % faster.

The RTX 4060 can easily play older titles in 4K UHD. With new games, however, this is more difficult, at least without the implementation of DLSS. Either way, gaming in 2.5K is possible.

Performance Rating – Percent
MSI Titan GT77 HX 13VI
Intel Core i9-13950HX, NVIDIA GeForce RTX 4090 Laptop GPU


100 pt ∼100%

Asus ROG Strix Scar 17 SE G733CX-LL014W
Intel Core i9-12950HX, NVIDIA GeForce RTX 3080 Ti Laptop GPU


74.6 pt ∼75%

MSI Katana 17 B13VFK
Intel Core i7-13620H, NVIDIA GeForce RTX 4060 Laptop GPU


67.6 pt ∼68%

Acer Predator Helios 300 (i7-12700H, RTX 3070 Ti)
Intel Core i7-12700H, NVIDIA GeForce RTX 3070 Ti Laptop GPU


66.4 pt ∼66%

MSI Pulse GL76 12UGK
Intel Core i7-12700H, NVIDIA GeForce RTX 3070 Laptop GPU


59.9 pt ∼60%

Average of class Gaming


56.5 pt ∼57%

Gigabyte G7 KE
Intel Core i5-12500H, NVIDIA GeForce RTX 3060 Laptop GPU


56.3 pt ∼56%

The Witcher 3 – 1920×1080 Ultra Graphics & Postprocessing (HBAO+)
MSI Titan GT77 HX 13VI
Intel Core i9-13950HX, NVIDIA GeForce RTX 4090 Laptop GPU


198.9 (190min, 191P1) fps ∼100% +90%

Acer Predator Helios 300 (i7-12700H, RTX 3070 Ti)
Intel Core i7-12700H, NVIDIA GeForce RTX 3070 Ti Laptop GPU


119 fps ∼60% +14%

Asus ROG Strix Scar 17 SE G733CX-LL014W
Intel Core i9-12950HX, NVIDIA GeForce RTX 3080 Ti Laptop GPU


118.8 (111min, 113P1) fps ∼60% +13%

MSI Katana 17 B13VFK
Intel Core i7-13620H, NVIDIA GeForce RTX 4060 Laptop GPU


104.7 (88min) fps ∼53%

Average of class Gaming
  (8.61 – 208, n=217, last 2 years)


94.7 fps ∼48% -10%

MSI Pulse GL76 12UGK
Intel Core i7-12700H, NVIDIA GeForce RTX 3070 Laptop GPU


92.8 (88min) fps ∼47% -11%

Gigabyte G7 KE
Intel Core i5-12500H, NVIDIA GeForce RTX 3060 Laptop GPU


82.4 (31.1min, 37.5P0.1, 50.1P1) fps ∼41% -21%

GTA V – 1920×1080 Highest Settings possible AA:4xMSAA + FX AF:16x
MSI Titan GT77 HX 13VI
Intel Core i9-13950HX, NVIDIA GeForce RTX 4090 Laptop GPU


140.9 (3.54min, 83.3P1) fps ∼100% +26%

Asus ROG Strix Scar 17 SE G733CX-LL014W
Intel Core i9-12950HX, NVIDIA GeForce RTX 3080 Ti Laptop GPU


126.7 (9.75min, 76.9P1) fps ∼90% +13%

Acer Predator Helios 300 (i7-12700H, RTX 3070 Ti)
Intel Core i7-12700H, NVIDIA GeForce RTX 3070 Ti Laptop GPU


112.9 (6.2min, 76.9P1) fps ∼80% +1%

MSI Katana 17 B13VFK
Intel Core i7-13620H, NVIDIA GeForce RTX 4060 Laptop GPU


112.1 (8min, 62.5P1) fps ∼80%

MSI Pulse GL76 12UGK
Intel Core i7-12700H, NVIDIA GeForce RTX 3070 Laptop GPU


108.1 (4.6min, 76.9P1) fps ∼77% -4%

Gigabyte G7 KE
Intel Core i5-12500H, NVIDIA GeForce RTX 3060 Laptop GPU


103 (10.4min, 71.4P1) fps ∼73% -8%

Average of class Gaming
  (4.18 – 145.5, n=210, last 2 years)


94.1 fps ∼67% -16%

Final Fantasy XV Benchmark – 1920×1080 High Quality
MSI Titan GT77 HX 13VI
Intel Core i9-13950HX, NVIDIA GeForce RTX 4090 Laptop GPU


187.4 fps ∼100% +95%

Asus ROG Strix Scar 17 SE G733CX-LL014W
Intel Core i9-12950HX, NVIDIA GeForce RTX 3080 Ti Laptop GPU


118.5 fps ∼63% +23%

Acer Predator Helios 300 (i7-12700H, RTX 3070 Ti)
Intel Core i7-12700H, NVIDIA GeForce RTX 3070 Ti Laptop GPU


116.8 fps ∼62% +22%

MSI Katana 17 B13VFK
Intel Core i7-13620H, NVIDIA GeForce RTX 4060 Laptop GPU


96.1 fps ∼51%

Average of class Gaming
  (9.13 – 187.4, n=209, last 2 years)


91.8 fps ∼49% -4%

MSI Pulse GL76 12UGK
Intel Core i7-12700H, NVIDIA GeForce RTX 3070 Laptop GPU


89.7 fps ∼48% -7%

Gigabyte G7 KE
Intel Core i5-12500H, NVIDIA GeForce RTX 3060 Laptop GPU


84.7 fps ∼45% -12%

Strange Brigade – 1920×1080 ultra AA:ultra AF:16
MSI Titan GT77 HX 13VI
Intel Core i9-13950HX, NVIDIA GeForce RTX 4090 Laptop GPU


373 (29.9min, 272P1) fps ∼100% +102%

Asus ROG Strix Scar 17 SE G733CX-LL014W
Intel Core i9-12950HX, NVIDIA GeForce RTX 3080 Ti Laptop GPU


211 (14.1min, 155.4P1) fps ∼57% +14%

Acer Predator Helios 300 (i7-12700H, RTX 3070 Ti)
Intel Core i7-12700H, NVIDIA GeForce RTX 3070 Ti Laptop GPU


209 (59min, 156.2P1) fps ∼56% +13%

MSI Katana 17 B13VFK
Intel Core i7-13620H, NVIDIA GeForce RTX 4060 Laptop GPU


185.1 (15.5min, 136.7P1) fps ∼50%

MSI Pulse GL76 12UGK
Intel Core i7-12700H, NVIDIA GeForce RTX 3070 Laptop GPU


164.5 (62.4min, 122.8P1) fps ∼44% -11%

Average of class Gaming
  (10.9 – 373, n=210, last 2 years)


164.1 fps ∼44% -11%

Gigabyte G7 KE
Intel Core i5-12500H, NVIDIA GeForce RTX 3060 Laptop GPU


146.4 (27.5min, 106.4P1) fps ∼39% -21%

Dota 2 Reborn – 1920×1080 ultra (3/3) best looking
MSI Titan GT77 HX 13VI
Intel Core i9-13950HX, NVIDIA GeForce RTX 4090 Laptop GPU


185.9 (157.5min) fps ∼100% +19%

Asus ROG Strix Scar 17 SE G733CX-LL014W
Intel Core i9-12950HX, NVIDIA GeForce RTX 3080 Ti Laptop GPU


169.8 (147.2min) fps ∼91% +9%

MSI Katana 17 B13VFK
Intel Core i7-13620H, NVIDIA GeForce RTX 4060 Laptop GPU


156.3 (132.3min) fps ∼84%

Gigabyte G7 KE
Intel Core i5-12500H, NVIDIA GeForce RTX 3060 Laptop GPU


137.3 (120.2min) fps ∼74% -12%

Acer Predator Helios 300 (i7-12700H, RTX 3070 Ti)
Intel Core i7-12700H, NVIDIA GeForce RTX 3070 Ti Laptop GPU


132.8 (108.1min) fps ∼71% -15%

MSI Pulse GL76 12UGK
Intel Core i7-12700H, NVIDIA GeForce RTX 3070 Laptop GPU


132.8 (116.8min) fps ∼71% -15%

Average of class Gaming
  (22 – 194.7, n=232, last 2 years)


126.6 fps ∼68% -19%

X-Plane 11.11 – 1920×1080 high (fps_test=3)
MSI Titan GT77 HX 13VI
Intel Core i9-13950HX, NVIDIA GeForce RTX 4090 Laptop GPU


134.2 fps ∼100% +13%

MSI Titan GT77 HX 13VI
Intel Core i9-13950HX, NVIDIA GeForce RTX 4090 Laptop GPU


134.1 fps ∼100% +13%

MSI Katana 17 B13VFK
Intel Core i7-13620H, NVIDIA GeForce RTX 4060 Laptop GPU


118.9 fps ∼89%

Asus ROG Strix Scar 17 SE G733CX-LL014W
Intel Core i9-12950HX, NVIDIA GeForce RTX 3080 Ti Laptop GPU


116.2 fps ∼87% -2%

MSI Pulse GL76 12UGK
Intel Core i7-12700H, NVIDIA GeForce RTX 3070 Laptop GPU


97.7 fps ∼73% -18%

Acer Predator Helios 300 (i7-12700H, RTX 3070 Ti)
Intel Core i7-12700H, NVIDIA GeForce RTX 3070 Ti Laptop GPU


92.4 fps ∼69% -22%

Gigabyte G7 KE
Intel Core i5-12500H, NVIDIA GeForce RTX 3060 Laptop GPU


86.8 fps ∼65% -27%

Average of class Gaming
  (12.4 – 142.8, n=231, last 2 years)


85.1 fps ∼63% -28%

05101520253035404550556065707580859095Tooltip

When performing undemanding tasks, the MSI Laptop Katana 17 runs mostly silent – but not always. When cooling is underway, at around 40 dB(A), the device runs comparatively loud. Under load, this rises to a maximum of 59 dB(A) which is very loud for sensitive ears but normal for gaming.

We didn’t detect any coil whine.

Noise Level

Idle

24.5 / 24.5 / 40 dB(A)

Load 48.3 / 59.1 dB(A)
  red to green bar
 

30 dB
silent

40 dB(A)
audible

50 dB(A)
loud


min: dark, med: mid, max: light   Earthworks M23R, Arta (15 cm distance)   environment noise: 24.5 dB(A)

dB(A) 0102030405060708090Deep BassMiddle BassHigh BassLower RangeMidsHigher MidsLower HighsMid HighsUpper HighsSuper Highs2038.328.728.948.22534.82624.248.83134.925.618.143.54033.730.425.641503226.922.2406332.62716.538.78033.427.915.639.310033.625.314.539.412531.62515.243.816030.326.91242.420031.525.3124025033.227.912.642.131534.12813.244.340034.127.212.343.450034.829.810.144.663036.130.310.544.580035.228.711.444.4100037.63111.646.3125039.732.611.448.4160039.731.112.248.9200039.130.613.248.8250038.127.214.248.8315035.724.413.848400032.119.91345.7500031.619.112.247.4630030.417.611.748800026.314.511.544.71000019.513.711.3381250017.614.211.936.81600014.814.211.230.8SPL48.340.124.559.1N6.23.10.513.7median 33.6median 26.9median 12median 44.5Delta3.25.10.63.4hearing rangehide median Fan Noise
MSI Katana 17 B13VFK
NVIDIA GeForce RTX 4060 Laptop GPU, i7-13620H, Micron 2400 MTFDKBA1T0QFM
MSI Titan GT77 HX 13VI
NVIDIA GeForce RTX 4090 Laptop GPU, i9-13950HX, Samsung PM9A1 MZVL22T0HBLB
MSI Pulse GL76 12UGK
GeForce RTX 3070 Laptop GPU, i7-12700H, Micron 3400 1TB MTFDKBA1T0TFH
Gigabyte G7 KE
GeForce RTX 3060 Laptop GPU, i5-12500H, Gigabyte AG470S1TB-SI B10
Asus ROG Strix Scar 17 SE G733CX-LL014W
GeForce RTX 3080 Ti Laptop GPU, i9-12950HX, Samsung PM9A1 MZVL22T0HBLB
Acer Predator Helios 300 (i7-12700H, RTX 3070 Ti)
GeForce RTX 3070 Ti Laptop GPU, i7-12700H, Samsung PM9A1 MZVL21T0HCLR
Noise

-2%

6%

-9%

16%

-0%

off / environment *

24.5

24.6

-0%

24.1

2%

27

-10%

23.9

2%

23

6%

Idle Minimum *

24.5

29.2

-19%

26.9

-10%

27

-10%

23.9

2%

23

6%

Idle Average *

24.5

29.2

-19%

26.9

-10%

35

-43%

23.9

2%

25.92

-6%

Idle Maximum *

40

29.2

27%

27

32%

38

5%

23.9

40%

40.67

-2%

Load Average *

48.3

50.7

-5%

43.8

9%

52

-8%

34.3

29%

42.7

12%

Witcher 3 ultra *

56

53.3

5%

44.7

20%

56

-0%

62.48

-12%

Load Maximum *

59.1

61

-3%

58.3

1%

59

-0%

45.9

22%

62.67

-6%

* … smaller is better

Stress test (Prime95+FurMark)

Good news: You shouldn’t worry about getting sweaty hands when using the Katana 17 as the palm rest area remains cool, even in stress tests. A maximum temperature of 45.5 degrees Celsius in the Witcher 3 test is also no cause for concern.

In the MSI Katana 17 B13V’s stress tests, we didn’t detect any throttling.

 38.6 °C
101 F
41 °C
106 F
34.2 °C
94 F
 
 35.7 °C
96 F
41.6 °C
107 F
28.2 °C
83 F
 
 22.3 °C
72 F
23.6 °C
74 F
22.4 °C
72 F
 
Maximum: 41.6 °C = 107 F
Average: 32 °C = 90 F
43.1 °C
110 F
42.8 °C
109 F
40.5 °C
105 F
24 °C
75 F
30.3 °C
87 F
26.6 °C
80 F
23 °C
73 F
23.2 °C
74 F
23 °C
73 F
Maximum: 43.1 °C = 110 F
Average: 30.7 °C = 87 F

Power Supply (max.)  35.2 °C = 95 F | Room Temperature 21 °C = 70 F | Fluke 62 Max+

(±) The average temperature for the upper side under maximal load is 32 °C / 90 F, compared to the average of 33.8 °C / 93 F for the devices in the class Gaming.
(±) The maximum temperature on the upper side is 41.6 °C / 107 F, compared to the average of 40.4 °C / 105 F, ranging from 21.2 to 68.8 °C for the class Gaming.
(±) The bottom heats up to a maximum of 43.1 °C / 110 F, compared to the average of 43.2 °C / 110 F
(+) In idle usage, the average temperature for the upper side is 27.8 °C / 82 F, compared to the device average of 33.8 °C / 93 F.
(+) Playing The Witcher 3, the average temperature for the upper side is 31.8 °C / 89 F, compared to the device average of 33.8 °C / 93 F.
(+) The palmrests and touchpad are cooler than skin temperature with a maximum of 24.2 °C / 75.6 F and are therefore cool to the touch.
(+) The average temperature of the palmrest area of similar devices was 29 °C / 84.2 F (+4.8 °C / 8.6 F).

The MSI Katana 17’s speakers are comparatively loud but lack bass. Instead, gamers should reach for a good headset, making fan noise inaudible.

dB(A) 0102030405060708090Deep BassMiddle BassHigh BassLower RangeMidsHigher MidsLower HighsMid HighsUpper HighsSuper Highs2028.929.12524.227.43118.125.94025.628.85022.226.96316.5288015.628.110014.527.312515.2331601236.92001246.425012.654.131513.260.740012.362.450010.168.363010.573.280011.474.1100011.671.2125011.464.3160012.264.7200013.262.2250014.260.8315013.859.540001355.1500012.255.6630011.765800011.563.21000011.357.41250011.950.71600011.254.3SPL24.578.5N0.541.4median 12median 60.7Delta0.66.332.830.732.840.436.240.441.640.341.632.529.232.529.624.729.632.717.732.727.717.127.72716.62734.216.634.245.817.345.850.922.850.953.81853.857.613.857.655.313.255.351.511.351.558.510.258.563.910.563.9669.86664.19.364.166.410.166.46210.36259.910.659.96010.96056.211.156.257.111.357.159.111.659.160.111.660.161.511.861.555.611.755.652.810.752.873.823.573.832.90.532.9median 57.6median 11.3median 57.64.12.44.1hearing rangehide median Pink Noise

The minimal consumption of around 12.2 watts is relatively high but typical for a gaming system. However, compared to the competition, consumption is still relatively low. 

The 240-watt power supply unit is sufficiently sized to cope with a maximum power consumption of 212 watts.  

MSI Katana 17 B13VFK
i7-13620H, NVIDIA GeForce RTX 4060 Laptop GPU, Micron 2400 MTFDKBA1T0QFM, IPS LED, 1920×1080, 17.30
MSI Titan GT77 HX 13VI
i9-13950HX, NVIDIA GeForce RTX 4090 Laptop GPU, Samsung PM9A1 MZVL22T0HBLB, Mini-LED, 3840×2160, 17.30
MSI Pulse GL76 12UGK
i7-12700H, GeForce RTX 3070 Laptop GPU, Micron 3400 1TB MTFDKBA1T0TFH, IPS, 1920×1080, 17.30
Gigabyte G7 KE
i5-12500H, GeForce RTX 3060 Laptop GPU, Gigabyte AG470S1TB-SI B10, IPS, 1920×1080, 17.30
Asus ROG Strix Scar 17 SE G733CX-LL014W
i9-12950HX, GeForce RTX 3080 Ti Laptop GPU, Samsung PM9A1 MZVL22T0HBLB, IPS, 2560×1440, 17.30
Acer Predator Helios 300 (i7-12700H, RTX 3070 Ti)
i7-12700H, GeForce RTX 3070 Ti Laptop GPU, Samsung PM9A1 MZVL21T0HCLR, IPS, 2560×1440, 17.30
Average NVIDIA GeForce RTX 4060 Laptop GPU
 
Average of class Gaming
 
Power Consumption

-55%

-14%

-22%

-61%

-41%

0%

-32%

Idle Minimum *

12.2

14

-15%

12.4

-2%

15

-23%

19.3

-58%

15

-23%

12.2

-0%

Battery Runtime

WiFi Websurfing (Edge 110)2h 56min
Load (maximum brightness)0h 58min
MSI Katana 17 B13VFK
i7-13620H, NVIDIA GeForce RTX 4060 Laptop GPU, 53.5 Wh
MSI Titan GT77 HX 13VI
i9-13950HX, NVIDIA GeForce RTX 4090 Laptop GPU, 99.9 Wh
MSI Pulse GL76 12UGK
i7-12700H, GeForce RTX 3070 Laptop GPU, 90 Wh
Gigabyte G7 KE
i5-12500H, GeForce RTX 3060 Laptop GPU, 54 Wh
Asus ROG Strix Scar 17 SE G733CX-LL014W
i9-12950HX, GeForce RTX 3080 Ti Laptop GPU, 90 Wh
Acer Predator Helios 300 (i7-12700H, RTX 3070 Ti)
i7-12700H, GeForce RTX 3070 Ti Laptop GPU, 90 Wh
Average of class Gaming
 
Battery Runtime

65%

108%

56%

42%

94%

78%

WiFi v1.3

176

319

81%

353

101%

317

80%

250

42%

362

106%

Reviewed: MSI Katana 17 B13V, review device provided by MSI Germany.

The MSI Katana 17 B13V laptop impressed us in its main area of competency – gaming. The Nvidia GeForce RTX 4060 ensures high-performance levels which can compete with the previous generation’s RTX 3070 Ti. In addition to the speedy GPU, the MSI comes with a 144 Hz display as well as an RGB keyboard and provides a very good typing experience. Despite the power at hand, the laptop remains comparatively cool.

Above all else, the main point of criticism is the display: It is not very bright and has poor color space coverage as well as high response times. Also, a USB-2.0 port is something 2023 can really do without. On top of this, we also found the keyboard layout to be poorly executed as keys such as FN have been moved to rather unusual locations. Poor battery life is to be expected from a gaming laptop but is still worthy of criticism nonetheless. 

The GeForce RTX 4060: The MSI 17 Katana B13V’s attraction stands or falls with the GPU.

Overall, the MSI Katana 17 has earned a good rating and, with the RTX 4060, is definitely an interesting choice for gamers. However, in times of inflation, this also applies to the previous generation’s devices such as the Gigabyte G7 KE with an RTX 3060. Price-conscious customers can save a lot of money on one of last-gen’s models. 

At the time of publishing this review, the MSI Katana 17 B14V is currently unavailable on Amazon and Best Buy. However, the previous generation model (3070Ti) can currently be had on Amazon for around 1499 dollars.

MSI Katana 17 B13VFK

02/21/2023 v7

Benjamin Herzig

Connectivity

52 / 80 → 65%

Application Performance

97%

Gaming – Weighted Average

Related Articles

Transparency

The present review sample was made available to the author as a loan by the manufacturer or a shop for the purposes of review. The lender had no influence on this review, nor did the manufacturer receive a copy of this review before publication. There was no obligation to publish this review.

Pricecompare

Benjamin Herzig, 2023-02-23 (Update: 2023-02-24)

Read More
Benjamin Herzig

Latest

Concord’s in the Rap Game: Latest Tie-Up Sees Company Managing Pop Smoke, Ski Mask the Slump God Catalogs

Photo Credit: Concord + Victor Victor Worldwide Concord announces a multi-year partnership with Victor Victor Worldwide to expand Concord’s presence in hip-hop. Independent music company Concord has announced a strategic multi-year venture with Victor Victor Worldwide (VVW), a New York-based record label founded by global entertainment executive Steven Victor. The partnership will help drive VVW’s

Want Your Music Featured on Netflix? Having a Major Label Helps

Music More Netflix blow-ups, please (Photo Credit: Yousafbhutta)Music Bagging...

Dhurandhar franchise re-writes film template as makers revise, review upcoming and existing films

Music SynopsisThe Dhurandhar franchise has redefined Hindi cinema. Its...

Newsletter

Don't miss

Concord’s in the Rap Game: Latest Tie-Up Sees Company Managing Pop Smoke, Ski Mask the Slump God Catalogs

Photo Credit: Concord + Victor Victor Worldwide Concord announces a multi-year partnership with Victor Victor Worldwide to expand Concord’s presence in hip-hop. Independent music company Concord has announced a strategic multi-year venture with Victor Victor Worldwide (VVW), a New York-based record label founded by global entertainment executive Steven Victor. The partnership will help drive VVW’s

Want Your Music Featured on Netflix? Having a Major Label Helps

Music More Netflix blow-ups, please (Photo Credit: Yousafbhutta)Music Bagging...

Dhurandhar franchise re-writes film template as makers revise, review upcoming and existing films

Music SynopsisThe Dhurandhar franchise has redefined Hindi cinema. Its...

Mario Wonder’s ‘Meetup In Bellabel Park’ Soundtrack Has Been Added To Nintendo Music

MusicWonderful! by Liam Doolan Thu 26th Mar 2026Earlier...

SoE necessary but not sufficient, business leaders say

PE­TER CHRISTO­PHER Se­nior Mul­ti­me­dia Re­porter pe­ter.christo­pher@guardian.co.tt Heavy hand­ed but nec­es­sary giv­en the state of crime in T&T. This was a com­mon as­sess­ment from var­i­ous busi­ness groups when asked for their per­spec­tive on the lat­est de­c­la­ra­tion of a state of emer­gency in the coun­try. The T&T Cham­ber of In­dus­try and Com­merce, in a re­leased is­sued yes­ter­day

The Big Business of Carolyn Bessette-Kennedy

Can a nine-episode limited series really impact an entire season of shopping trends? Today brands are experiencing—and chasing—the “Carolyn Bessette-Kennedy effect” as a result of Ryan Murphy’s Love Story. And in many cases, it’s more pervasive than they could have prepared for. The FX series, based on the relationship between John F. Kennedy Jr. and

‘Mind Your Own Business’: Kamal Haasan Rebukes Trump Over ‘Permission’ To Buy Russian Oil

Updated 8 March 2026 at 18:20 IST Actor and Rajya Sabha MP Kamal Haasan has hit out at US President Donald Trump after America announced that it has given India temporary "permission" to buy Russian oil amid global supply disruptions caused by the Middle East conflict. 'Mind Your Own Business': Kamal Haasan Rebukes Trump Over